


A Golden Cross BUY Signal is generated when the 50-day EMA of a price index crosses up through its 200-day EMA. DecisionPoint’s Golden Cross Index (GCI) shows the percentage of stocks in an price index have a Golden Cross BUY Signal, and is an expression of long-term strength.
A Silver Cross BUY Signal is generated when the 20-day EMA of a price index crosses up through its 50-day EMA. DecisionPoint’s Silver Cross Index (SCI) shows the percentage of stocks in a price index have a Silver Cross BUY Signal, and is an expression of intermediate-term strength.
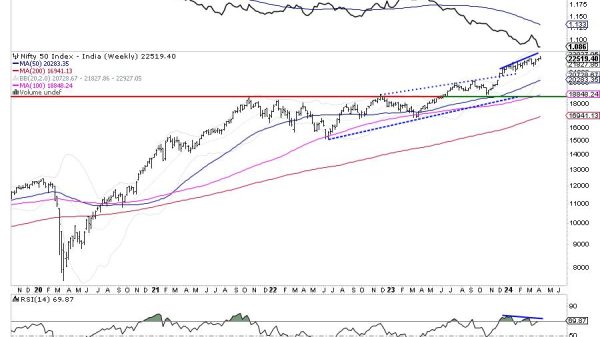
Let’s focus on the Silver Cross Index on the chart below. We can see that it has moved down from a high of about 90 percent in January to 72 percent, which creates a negative divergence against the rising price index (SPY). In order to lose a Silver Cross BUY, price must move below the 20-day EMA and 50-day EMA. Rreferring to the chart panels showing % Stocks > 20EMA and 50EMA, currently 62 percent of stocks are below both of those EMAs, meaning the SCI can drop another 10 percent. As the SCI continues to deteriorate, that will put downward pressure on the S&P 500.
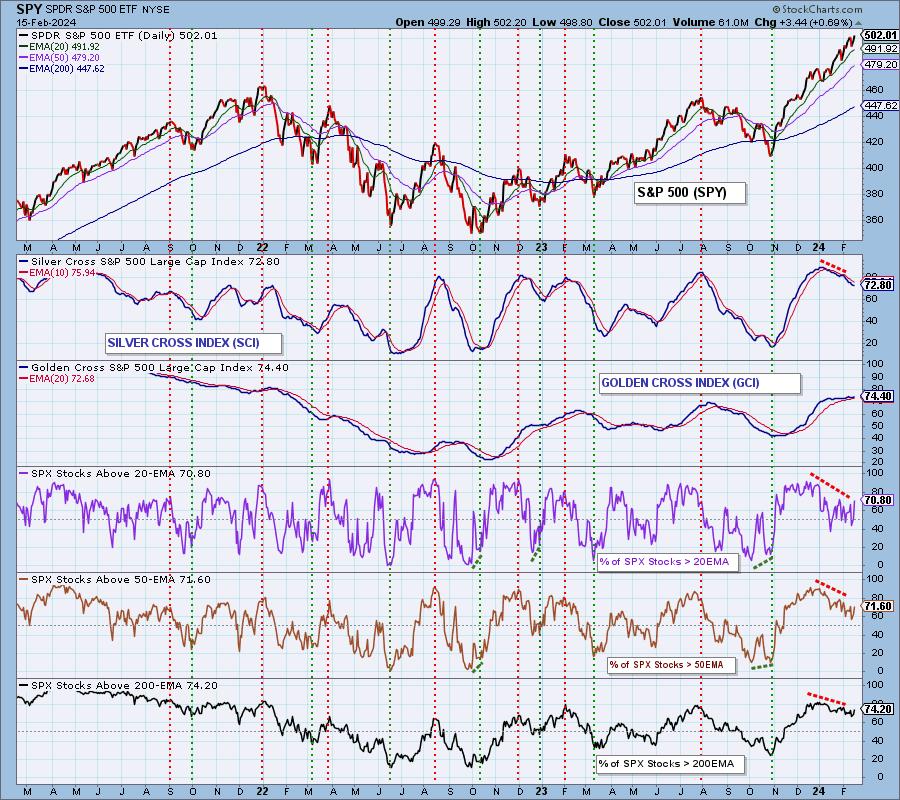
The long-term picture on the Golden Cross Index is not so pressing. The GCI is currently at 73 percent and the % Stocks > 200EMA is at 69 percent, which is not a serious amount of potential deterioration.
Conclusion: The rally is being undermined by continued deterioration in the percentage of stocks with Silver Cross BUY Signals. The fact that prices continue to rise demonstrates the increasing influence of larger-cap stocks, so it is not guaranteed that prices will ultimately break downward. Nevertheless, it is not a healthy condition, and increased caution is needed.
___________
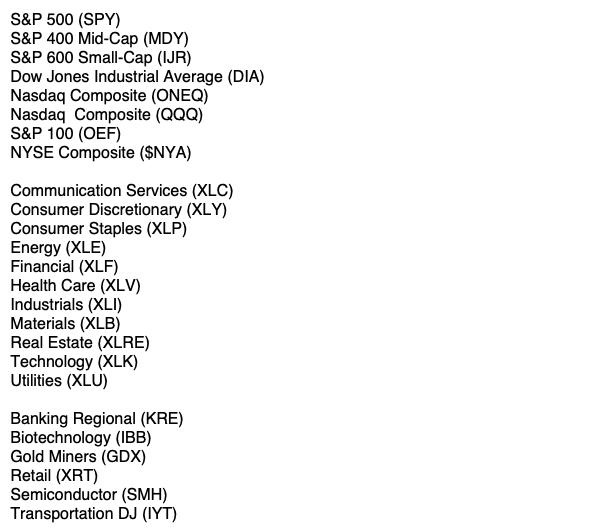
These are the market, sector, and industry group indexes for which we have individual Silver Cross and Golden Cross Indexes.
Learn more about DecisionPoint.com:
Watch the latest episode of the DecisionPointTrading Room on DP’s YouTube channel here!

Try us out for two weeks with a trial subscription!
Use coupon code: DPTRIAL2 at checkout!
Technical Analysis is a windsock, not a crystal ball. –Carl Swenlin
(c) Copyright 2024 DecisionPoint.com
Disclaimer: This blog is for educational purposes only and should not be construed as financial advice. The ideas and strategies should never be used without first assessing your own personal and financial situation, or without consulting a financial professional. Any opinions expressed herein are solely those of the author, and do not in any way represent the views or opinions of any other person or entity.
DecisionPoint is not a registered investment advisor. Investment and trading decisions are solely your responsibility. DecisionPoint newsletters, blogs or website materials should NOT be interpreted as a recommendation or solicitation to buy or sell any security or to take any specific action.
Helpful DecisionPoint Links:
Price Momentum Oscillator (PMO)
Swenlin Trading Oscillators (STO-B and STO-V)