


The demand for sports entertainment is constant across each seasonal turn. And for every season, there’s a sport in full swing. Though a discretionary item, the demand for fantasy sports and sports betting is tied to the ongoing sports season, and its popularity is only increasing.
DraftKings (DKNG), one of the more dominant players in this field with a 31% market share lead, has seen such a surge in its stock price that it’s become overbought, according to a number of indicators. DKNG was filtered in a bearish Overbought with a Declining RSI scan in the StockCharts Scan Engine.
Yesterday, DraftKings reported earnings, increasing its revenue by 44% and significantly decreasing operating losses while topping estimates in its full-year guidance. Yet while bears may be shadowing or shorting DKNG (it has a 4.35% short interest as of the end of January), many analysts and investors seem bullish on it.
So, we’re looking at a battle between bulls and bears at the edge of a disputed “overvalued” cliff. Who’s going to give?
Big Picture: DraftKings Has Entered the Retracement Red Zone
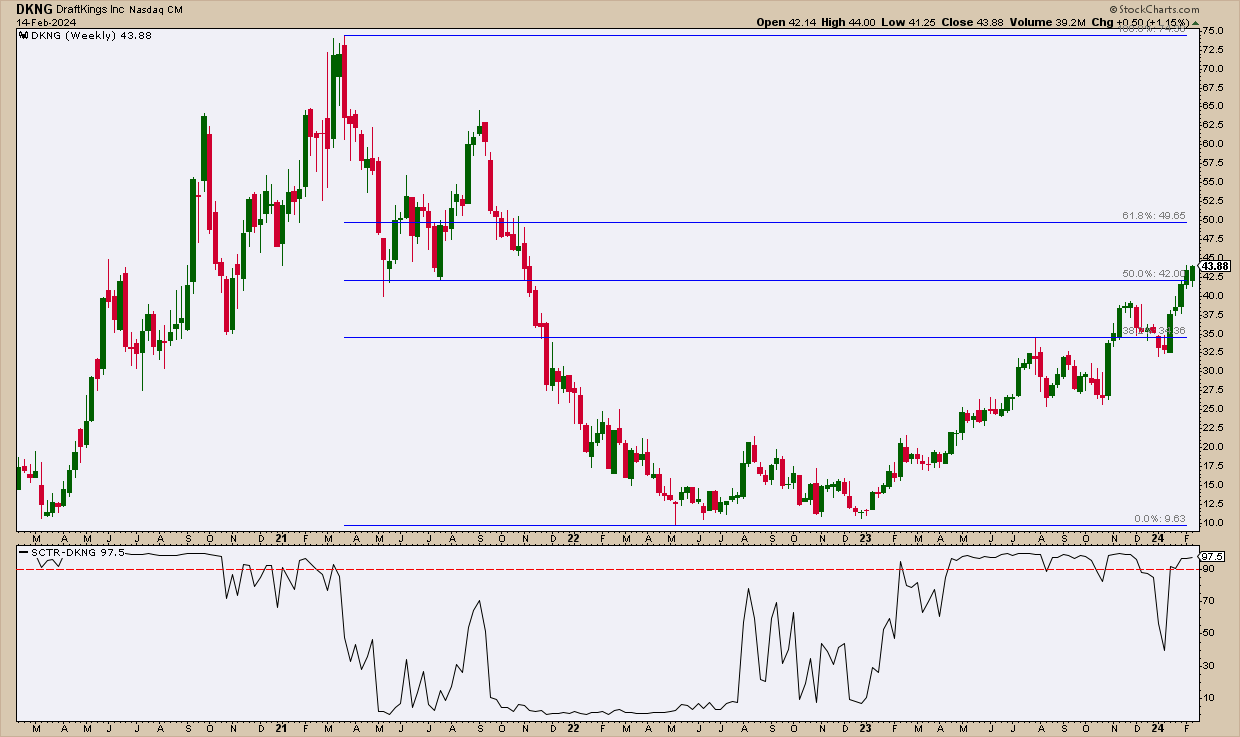
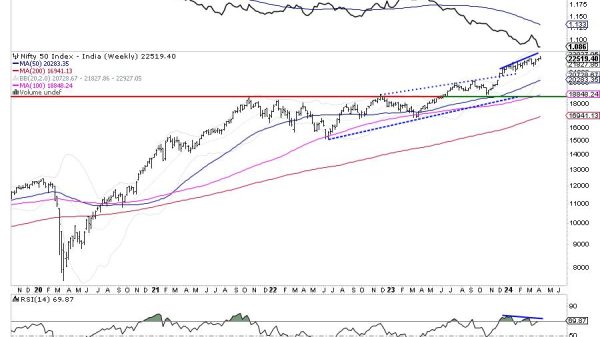
CHART 1. WEEKLY CHART OF DRAFTKINGS. DraftKings SCTR reading has been “pedal to the metal” on the upside for a year, despite a few dips. It makes you want to check its relative performance against the broader market, sector, and industry peers. Still, that Fib retracement looks tempting for bears looking to pounce. Chart source: StockCharts.com. For educational purposes.
With a StockCharts Technical Rank (SCTR) score of 97.5, DKNG’s technical readings look exceedingly bullish to the point of overheating. But is it a trap?
Drawing a long-term Fibonacci retracement from its highest high of $74.38 in March 2021 to its bottom of $9.77 in May 2022, DKNG’s recent surge has entered the space above the 50% retracement.
A three-year Fib retracement may seem like a long period, but bears who got in near the top and bulls who got in toward the bottom might see this as an opportunity to close positions with a profit. This leaves those still looking to enter, either long or short, with a bit of a conundrum.
DraftKings Stock: An Exhausted Winner?
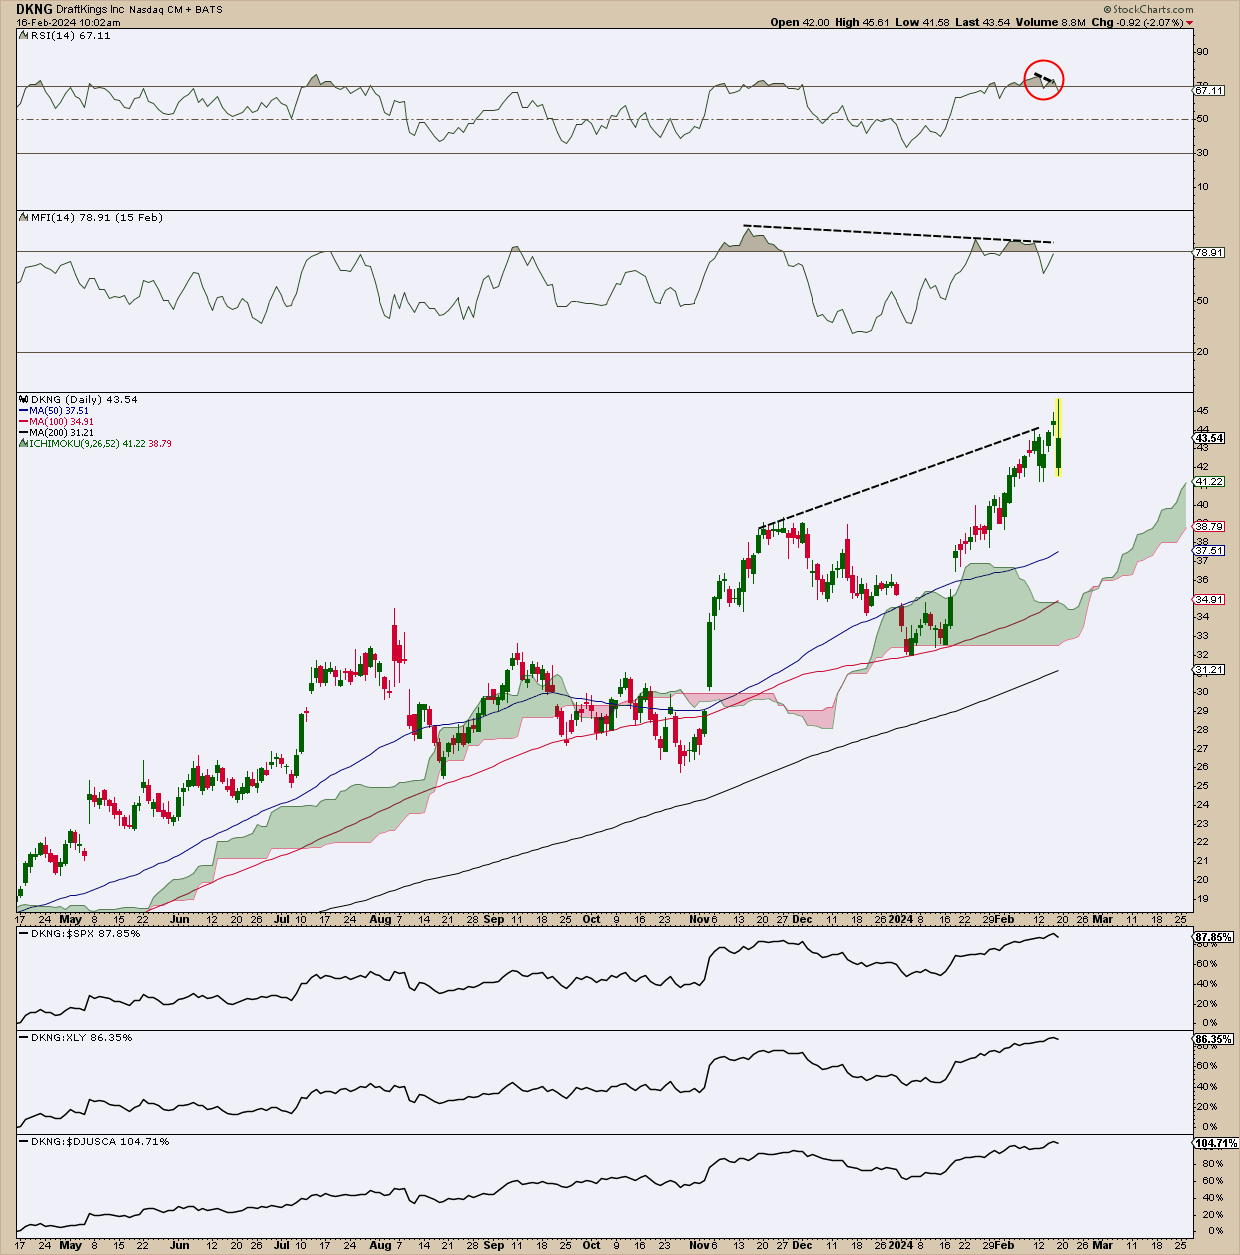
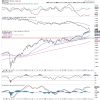
CHART 2. DAILY CHART OF DRAFTKINGS. DKNG has been outperforming the market, and its 2024 guidance offers a bullish glimpse into the coming quarters. But it needs a breather, and if you’re looking to buy the dip, you need to set a price alert to prepare yourself for it.
As mentioned, DraftKings popped up on an Overbought with a Declining RSI scan. This indicates bearish divergence: prices have risen into overbought territory while the RSI reading is falling.
If you look at the panels above the price chart, the relative strength index (RSI) is paired with a Money Flow Index (MFI) indicator—a volume-weighted RSI—to confirm and show more clearly this divergence, which is barely visible on the RSI (black dotted lines).
Now, look at the three price performance indicators in the panels below the price chart. This illustrates the extent to which DraftKings has outperformed the S&P 500 (87.85%), the Consumer Discretionary sector (86.35%), and the Gambling industry (104.71%).
DraftKings’ performance is that of a winner. And on Friday, a day after reporting its Q4 earnings, it logged in a 52-week high before backing off from its session high. Is its momentum exhausted? The answer is that it can continue running despite its overbought readings.
Eventually, though, all rallies need a breather. Bears will look for a reversal on strong momentum. Depending on whether they’re shorting for the near-term or long-term, their technical price target can be any of several swing lows (all potential support levels) on the way down.
As for bulls looking to buy on a pullback, you have to wait for a pullback (which hasn’t yet happened at the time of writing). The RSI and MFI can help you gauge the depth of the pullback alongside the actual price action (e.g., support and resistance). And if it happens to pull back in the near term, you might want to set a price alert at $34.50, which coincides with its July high and November–December support levels.
The 50-day, 100-day, and 200-day simple moving averages, all in full sail, can provide you with a favorable support range, which, if you reference it with the Ichimoku cloud range, might help you anticipate a bullish reversal. But you must ensure the upside bounce has enough momentum to be sustainable (e.g. a bullish candle backed by high volume and some follow-through).
The Bottom Line
To wrap things up, DraftKings stands at a critical juncture, flaunting strong market performance at the edge of near-term burnout. Still, the company forecasts robust prospects for the year to come. Investors looking to get in are waiting for the dust to settle, eyeing the perfect moment to dive into the fray, hoping to catch the next upswing.
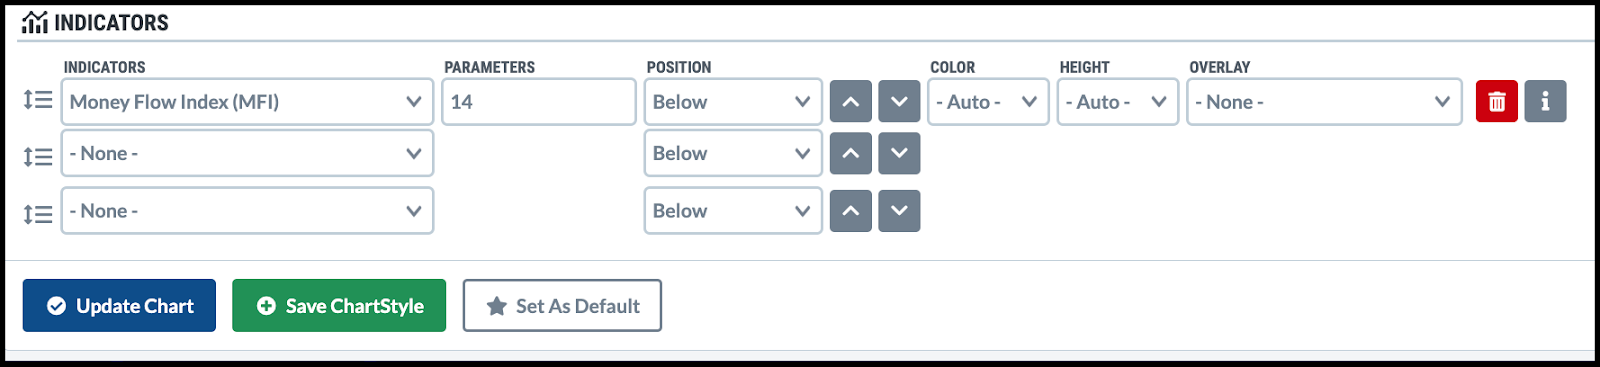
 Adding Indicators to Charts
Bring up a price chart in SharpCharts and add in the Money Flow Index and other indicators from the Indicators dropdown menu.
Disclaimer: This blog is for educational purposes only and should not be construed as financial advice. The ideas and strategies should never be used without first assessing your own personal and financial situation, or without consulting a financial professional.