


 Chartists can improve their odds by focusing on stocks that are in long-term uptrends and showing upside leadership. This is similar to a dual-momentum approach, which was covered last week. Today’s example will use the 40-week SMA to define the trend, a 52-week high to confirm upside leadership and a classic bullish continuation pattern for timing.
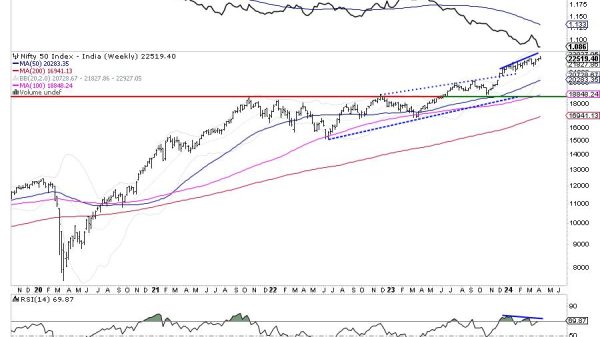
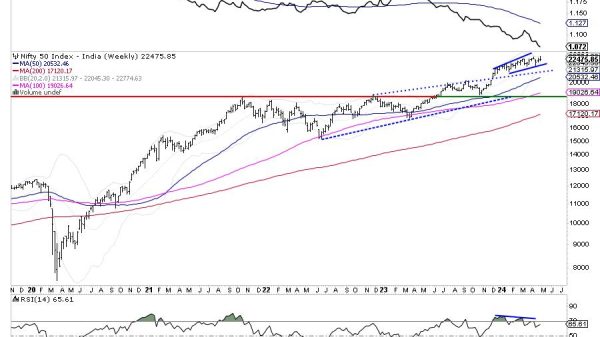
The chart below shows weekly candlesticks with the 40-week SMA (red line). For starters, IDXX is in a long-term uptrend because it is well above its 40-week SMA, which is equivalent to the 200-day SMA. This stock also shows leadership because it is trading near a 52-week high. The dashed red line shows the January 2022 high with IDXX exceeding this level three weeks ago. The stock closed strong last week and remains near a 52-week high. This first step, uptrend and leadership, is how we approach trading at TrendInvestorPro.
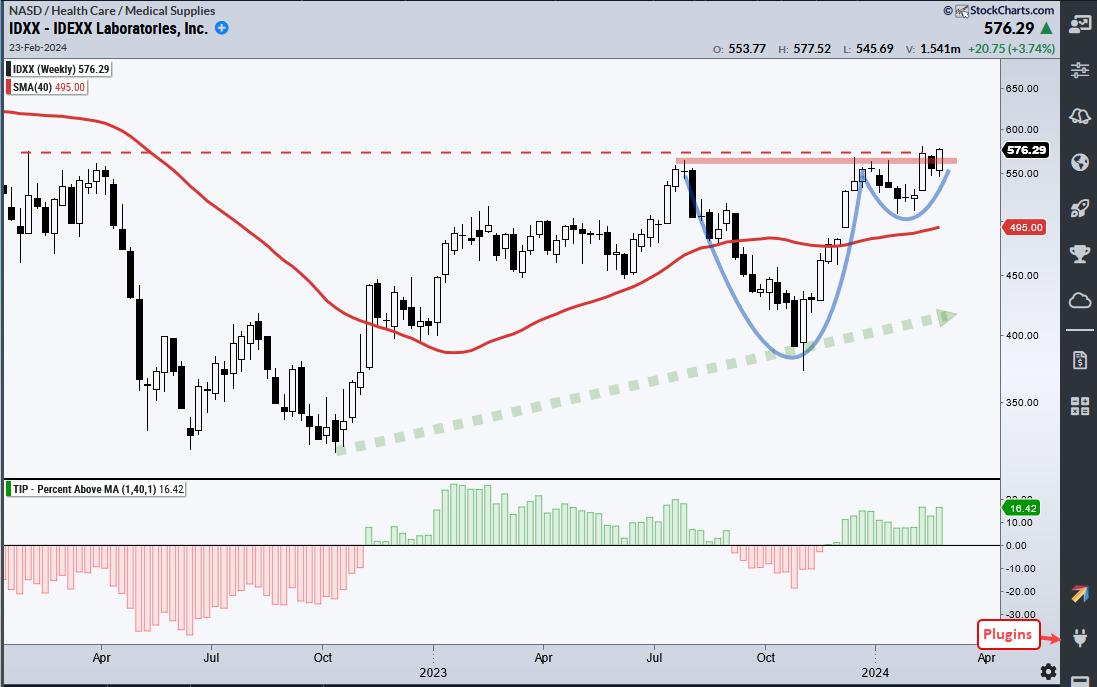
A bullish continuation pattern formed over the last seven months with IDXX breaking out this month. The blue lines mark a cup-with-handle pattern, which was popularized by William O’Neil of IBD. The cup formed in the second half of 2022 and the handle formed in 2024. This handle is a consolidation after the sharp advance from early November to mid December. Rim resistance is set using the pattern highs (red line). IDXX broke out of this pattern with a surge three weeks ago and is back above with a nice gain this past week. This breakout signals a continuation of the bigger uptrend. I would re-evaluate on a close below the 200-day SMA.
The indicator window shows Percent above MA (1,40,1), which measures the percentage difference between the close and the 40-week SMA. For reference, IDXX is currently 16.42% above its 40-week SMA. Note that this indicator is part of the TrendInvestorPro Indicator Edge Plugin for StockCharts ACP.
Chart Trader reports and videos focus on leading stocks and ETFs in uptrends. Each week we cover the overall market environment and then feature highly curated trading ideas. This week we covered the Biotech ETF (IBB), L3Harris (LHX), Teledyne (TDY), the Bank ETF (KBWB) and the Robotics ETF (ROBO). Click here to learn more and get immediate access.
///////////////////////////////////