


Energy Improving in Three Time Frames
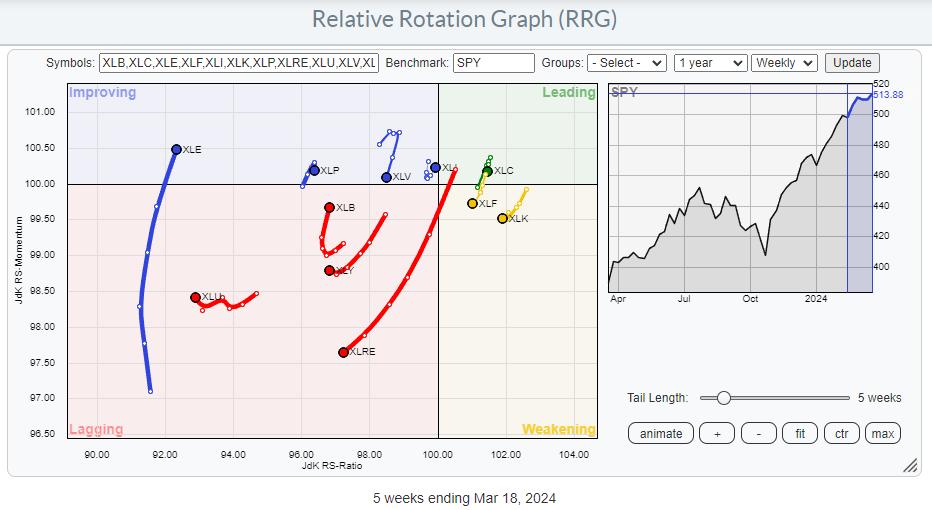
Watching sector rotation at the start of this week shows a continued improvement for the Energy sector (XLE). Even though XLE has the lowest reading on the JdK RS-Ratio scale, it has a long tail, and it has just entered the improving quadrant.
This happens after a very long rotation and at very low RS-Ratio levels, but when I combine this rotation with the XLE tails on the daily and monthly RRGs, it becomes interesting.
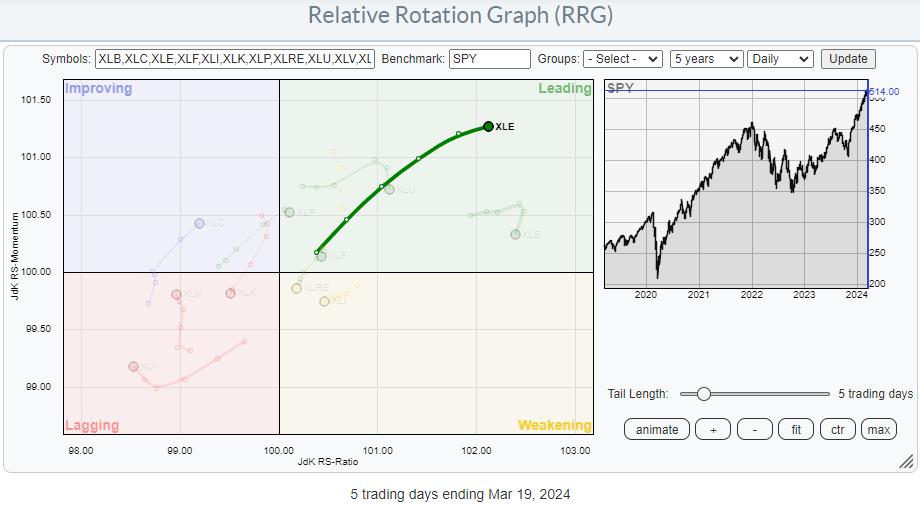
On the daily RRG the tail is well inside the leading quadrant and still pushing higher on strong momentum. The RRG-Heading has slowed slightly but is still within 0-90 degrees.
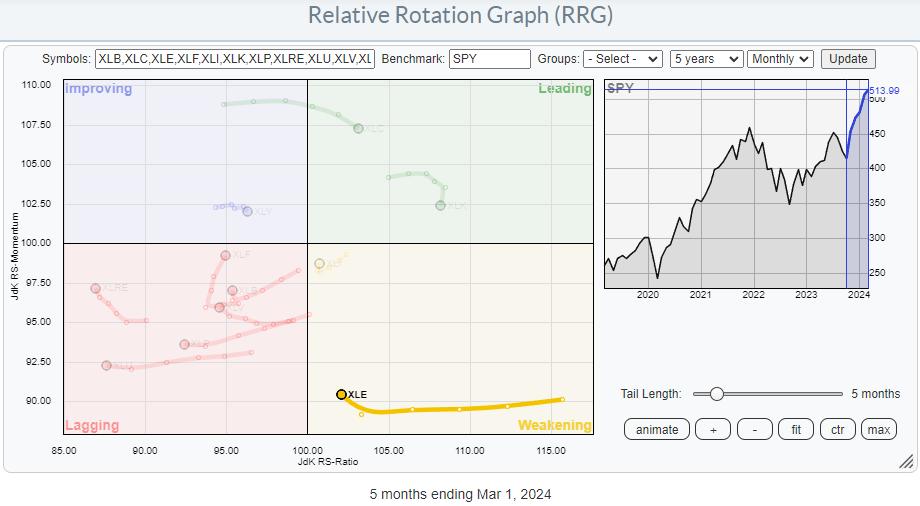
On the monthly RRG, the XLE tail is still inside the weakening quadrant and starting to hook back up. This is interesting as it signals the potential start of a new up-leg in the already existing relative uptrend.
All in all, this means we now have positive developments for the energy sector in all three time frames.
Getting Close To Major Overhead Resistance Area
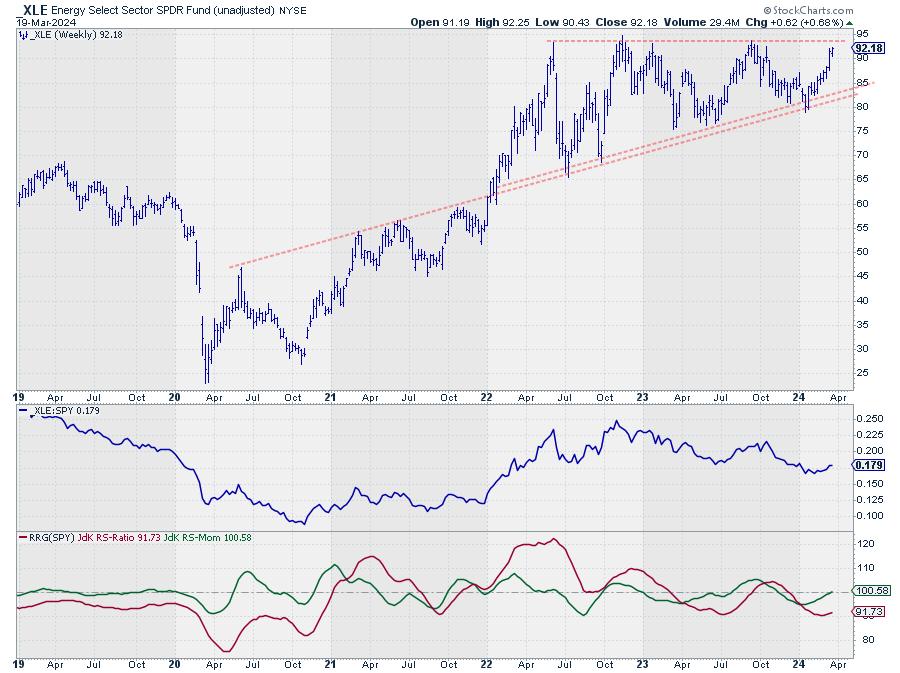
And the improvement is not only relative. On the price chart, XLE is now moving towards overhead resistance offered by four major highs since 2022 which were all set just below 95.
Be careful, with the big rallies that have taken place in major markets and sectors, it is easy to think that breaking that 95 barrier in XLE would mean a break to new all-time-highs.. That is NOT the case for the energy sector. As you can see on the monthly chart below.
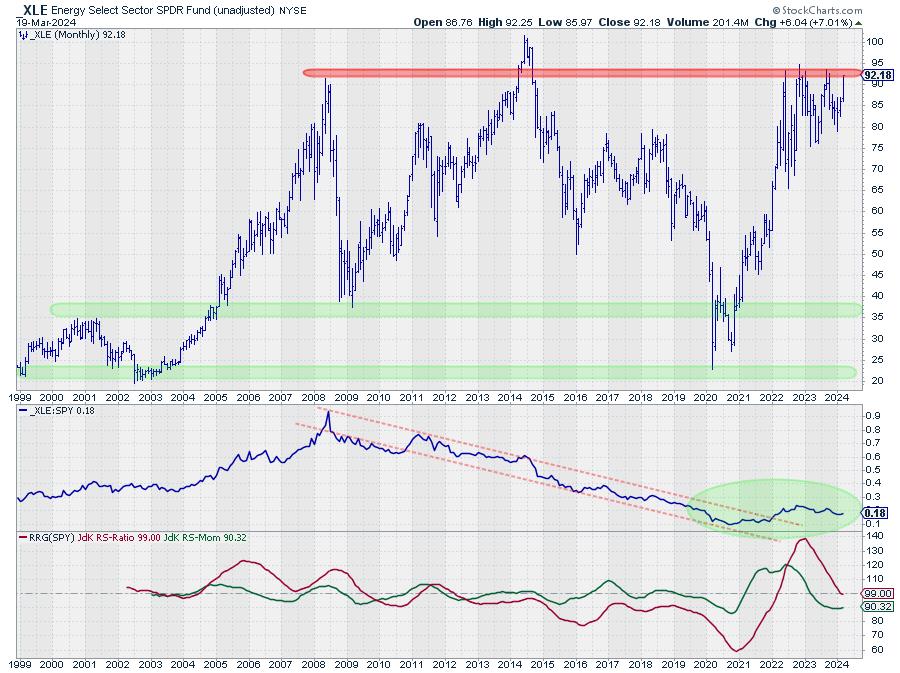
The 95 area is undeniably an important resistance level and when it can be broken that will certainly fuel (pun intended) a further rally towards the all-time-high level for XLE which is at 101.52 in June 2014. Almost 10 years ago.
What is also interesting to see is that XLE tested support coming from lows dating back as far as 1999 and 2002 around 20, only four years ago in 2020. Out of that low a 475% rally emerged taking XLE from 26 to 95 which is more than any other sector in the same time period.
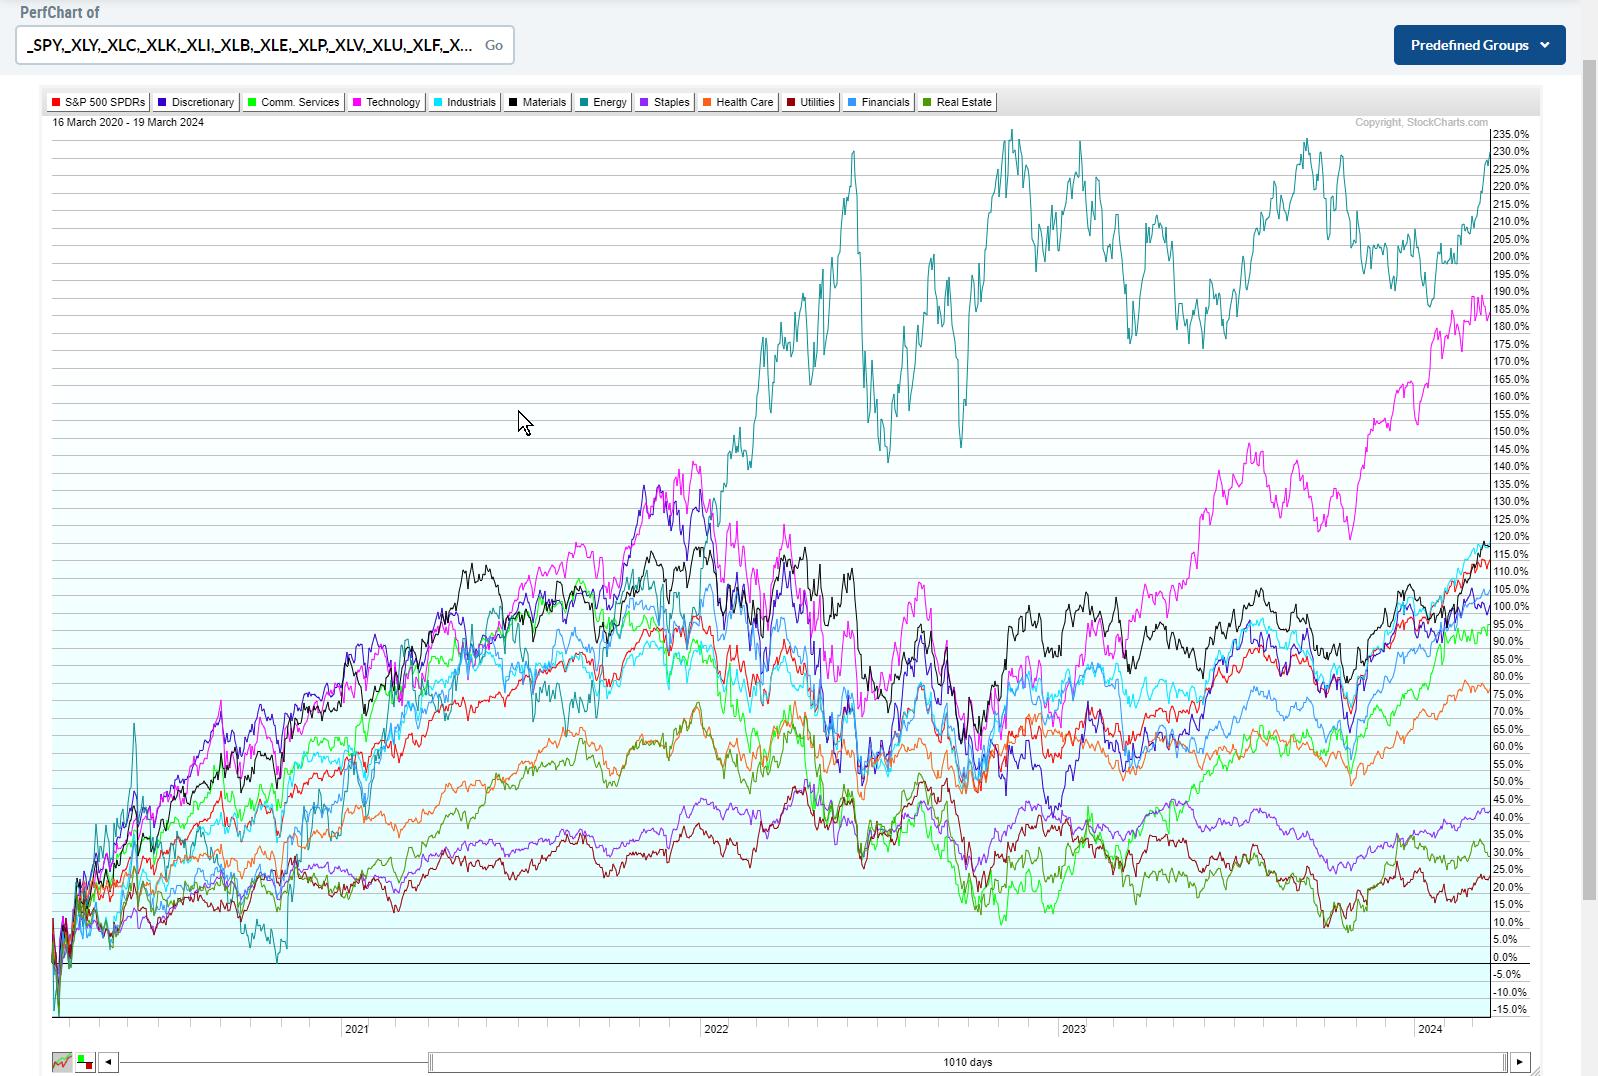
This PerfChart shows the performance for all sectors since the March 2020 low. The teal line at the top is XLE. Only XLK in purple comes close to the performance of XLE and only because of the rally that started in October 2022.
Long Term Turnaround In the Making
It is this huge outperformance that has kept the XLE tail on the monthly RRG on the right hand side of the graph for so long and the recent relative improvement is causing this monthly tail to start curling up again.
As you know the usual message in case of a hook back up inside the weakening quadrant is for starting a new up-leg within an already rising relative trend.
Looking at the monthly chart of XLE in combination with the RRG-Lines and raw RS above, that is exactly what seems to be happening. And it is happening after an initial rally that ended a relative downtrend of XLE that started back in 2008.
When the raw RS value of Energy vs SPY climbs above 0.25 an acceleration in relative strength, and a much further rally in favor of Energy is likely.
–Julius