


Good morning and welcome to this week’s Flight Path. The equity “Go” trend is over. We saw a pink “NoGo” bar following an amber “Go Fish” bar of uncertainty and then that was followed by strong purple bars as the week continued. Treasury bond prices remained in a strong “NoGo” trend as we saw an entire week of uninterrupted “NoGo” strong purple bars. Commodity prices hung on through a period of weakness to paint a strong blue bar at the end of the week. The dollar showed strength all week as GoNoGo Trend. colored all of the bars a strong blue “Go”.

Equities Roll Over into “NoGo”
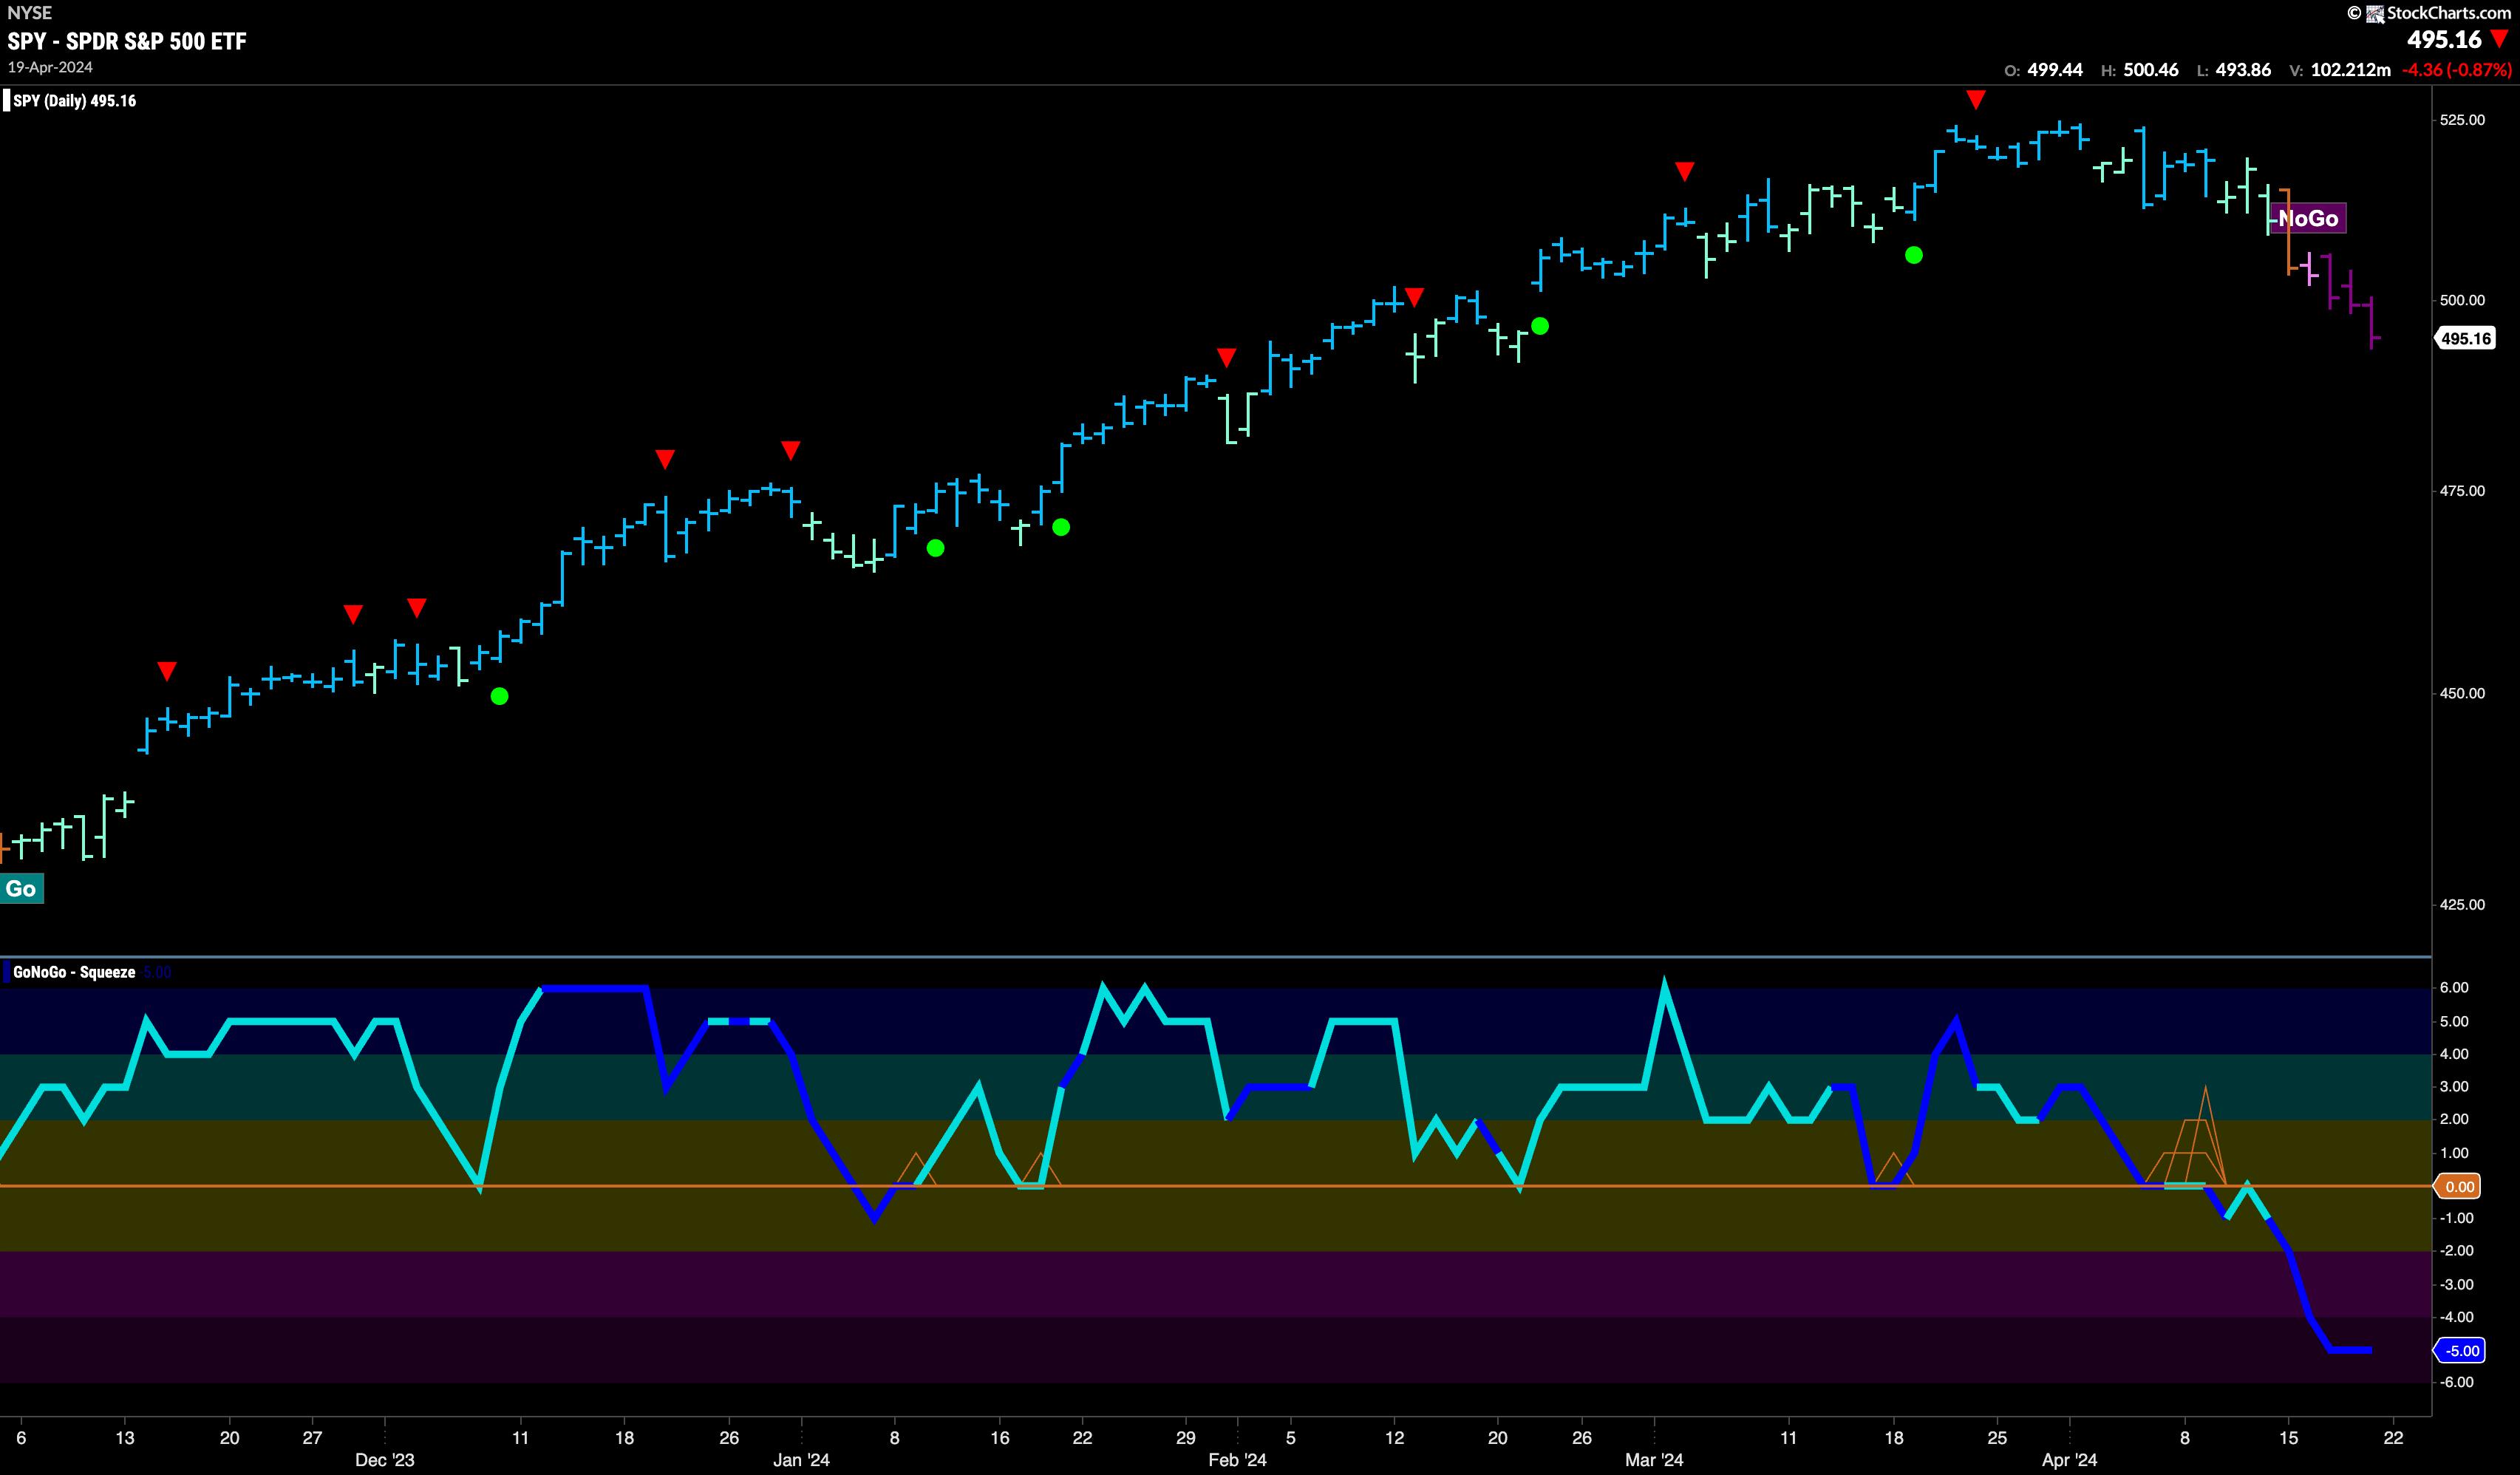
Last week we noted the weakness we had seen in the “Go” trend. The last high triggered a Go Countertrend Correction Icon (red arrow) that indicated prices may struggle to go higher in the short term. Prices moved mostly sideways or away from the high since then and this past week saw the technical environment change. First, an amber “Go Fish” bar reminded us that there was uncertainty in the current trend, and that quickly gave way to a pink “NoGo” bar. Without looking back, the latter part of the week saw strong purple “NoGo” bars as price moved progressively lower.

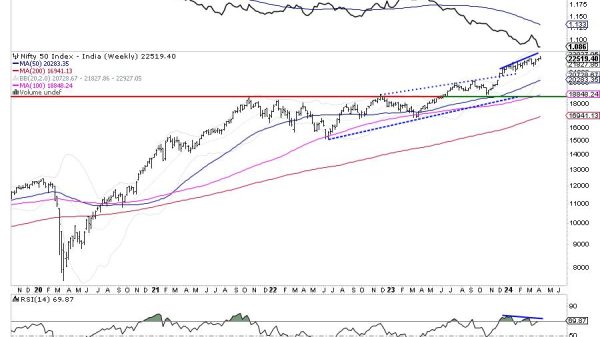
Last week’s paler aqua “Go” bar brought with it a Go Countertrend Correction Icon (red arrow). This week we see price falling further from the most recent high as GoNoGo Trend paints a second weaker aqua bar. We look to the oscillator panel and see that it is fast approaching the zero line. That will be the next important test of this “Go” trend. As price continues to fall, we will want to see support found by the oscillator at zero. If it finds it, we will expect price to set a new higher low and can look for signs of trend continuation. If the oscillator fails to find support at the zero line, we could well see a deeper correction and possible trend change in the price panel.

Rates in Strong “Go” Trend
We saw a week of strong blue “Go” bars in treasury rates. After hitting a high in the beginning of the week the chart triggered a Go Countertrend Correction Icon (red arrow) and we know that it will be hard for price to rise higher in the short term. GoNoGo Oscillator is in positive territory but no longer overbought. After some consolidation at these levels we will look to see if the trend can continue.

Dollar Takes a Pause at New Highs
After last week’s gap higher, we saw price consolidate at these new higher levels. GoNoGo Trend painted a full week of strong blue bars and we will look at the top of that gap for potential support going forward. GoNoGo Oscillator remains overbought at a value of 5 and volume is heavy. We will watch to see if momentum wanes, giving us a Go Countertrend Correction Icon on the chart and leading to further price consolidation.

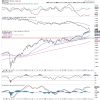
The longer term chart shows clearly where long term support should now be found. Last week’s strong price action pushed price above horizontal resistance that we see on the chart from prior highs. There is some likelihood that price takes a breath soon as momentum is overbought. As it moves back into neutral territory and potentially toward the zero line we will look for price support at the horizontal level and for oscillator support at the zero line.