


Using technical indicators to identify stocks fundamentally undervalued but technically strengthening is a common practice. But, using indicators to find fundamentally strong stocks that happen to be technically undervalued (or contested) is probably less common, especially if you lean toward technicals.
That was certainly the case with Alphabet Inc (GOOGL), leading to Friday’s 15% spike and price gap, the sharpest rally since 2015. Alphabet’s earnings and revenue results soared past Wall Street’s expectations. But the extraordinary news was the declaration of the company’s first-ever dividend (20 cents per share) and a $70 billion buyback, providing substantial benefits to shareholders.
The dividend and buyback part was unpredictable. But the case for having bought (and held) GOOGL was present in the fundamentals and technicals, notably when the technicals indicated significant weakness.
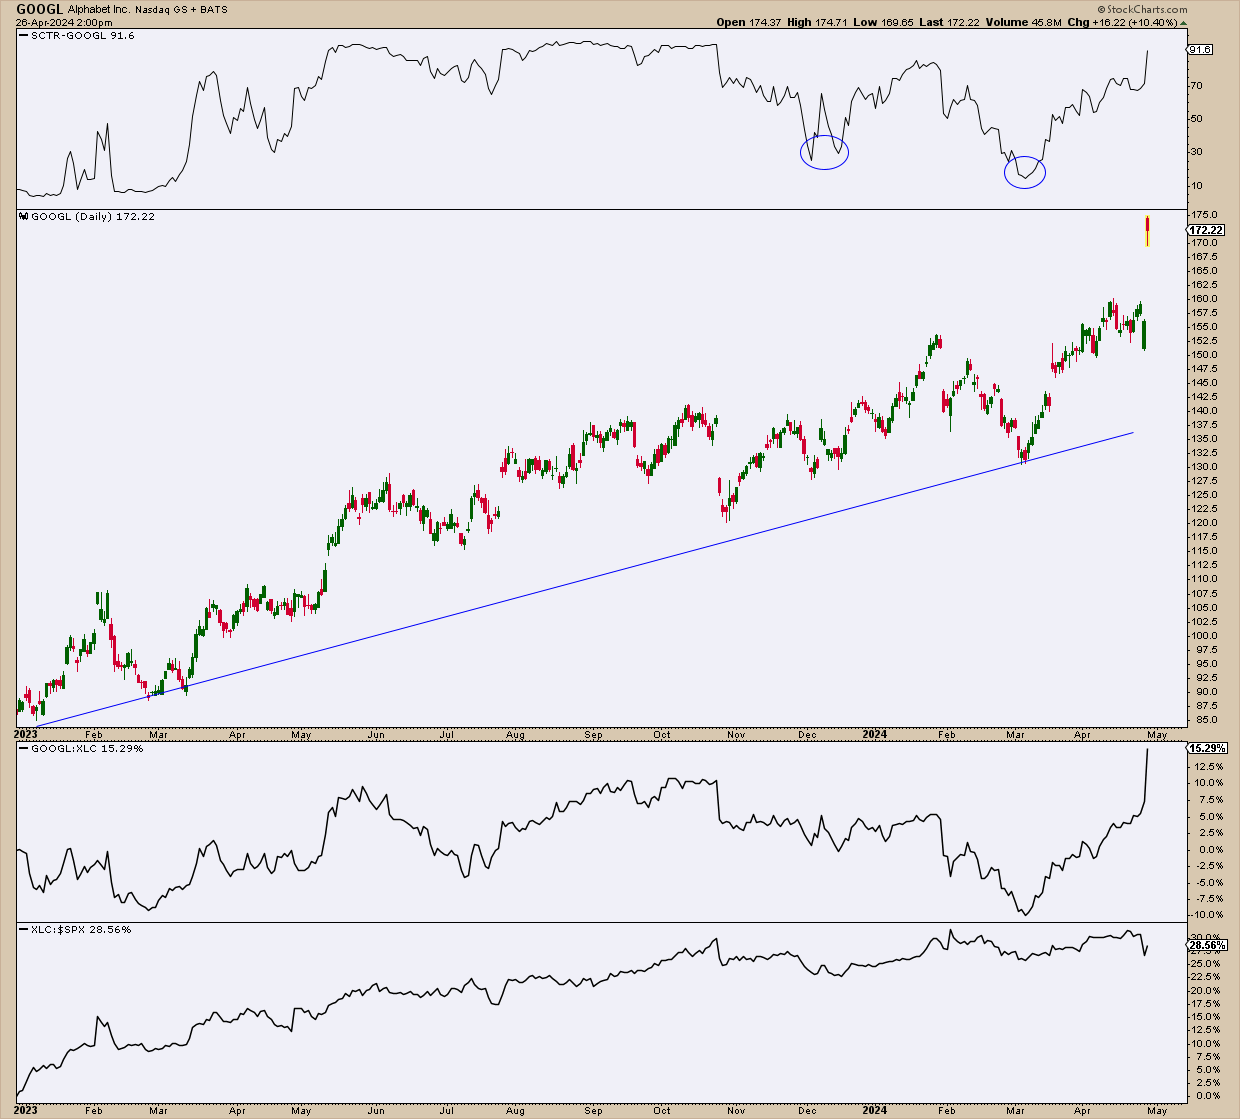
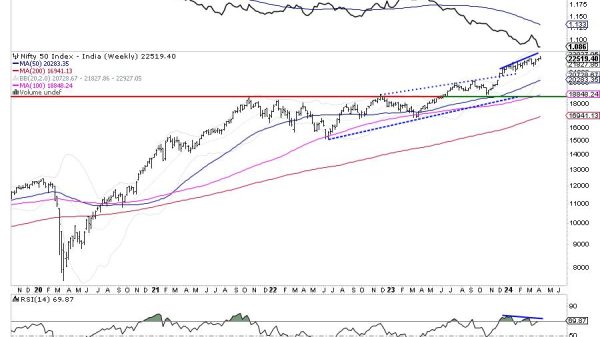
FIGURE 1. DAILY CHART OF ALPHABET SINCE 2023. The Communications sector outperformed the S&P 500 consistently, while Alphabet began underperforming the sector toward the end of 2023.Chart source: StockCharts.com. For educational purposes.
Alphabet’s StockCharts Technical Rank (SCTR) scores at the beginning of 2023 were quite dismal, though the stock began picking up steam shortly after. Alphabet had a big earnings miss in February 2023, yet analysts would argue that the miss was “baked-in.”
The SCTR line started trending downward in October 2023, hitting consecutive lows in December of that year and, most recently, March, where the SCTR score plunged to a 10, an exceedingly bearish technical reading.
Relative performance against its sector (XLC), would have confirmed Alphabet’s relative weakness, as it grossly underperformed it by -10%. Meanwhile, XLC (the Communications sector proxy) steadily outperformed the S&P 500, as you can see in the chart above.
All signs read “bearish” in bold letters, except for a couple of things:
- Fundamentally, its earnings performance after Feb 2023 had shown nothing but consecutive strength.
- Technically, Alphabet was in a strong uptrend (and a long one) despite its sector underperformance and various other indications of technical weakness.
So, was it technically undervalued, save for the one thing that perhaps mattered the most: the direction of the larger trend?
Running Bullish Scans
For context, Alphabet came up on a scan for Outperforming SPY: 52-Week Relative Highs. It wasn’t there yesterday. But if you did a quick Symbol Summary search on Friday morning, you would have seen GOOGL pop up on several bullish scans.
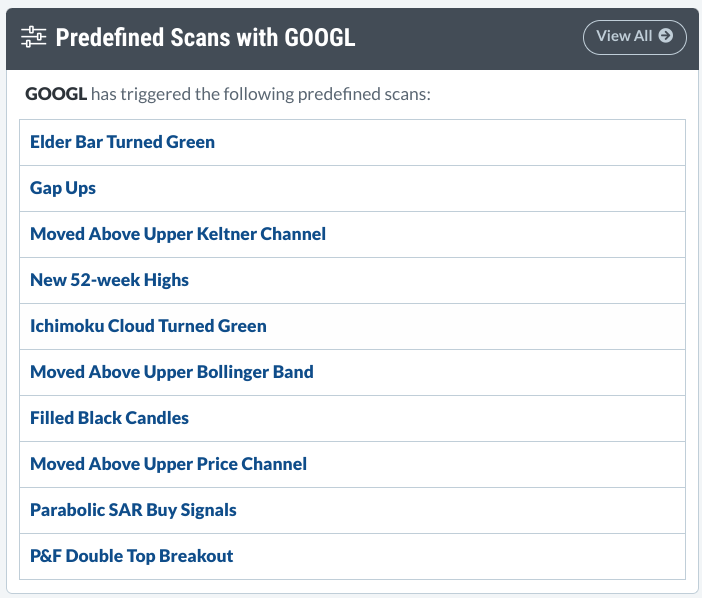
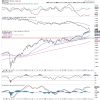
FIGURE 2. PREDEFINED SCAN LISTING IN THE STOCKCHARTS SYMBOL SUMMARY TOOL. What a difference a day makes!Chart source: StockCharts.com. For educational purposes.
So, now that the retail crowd is joining those who have long been “long,” is it too late to jump in?
It’s a Wait-and-See Moment
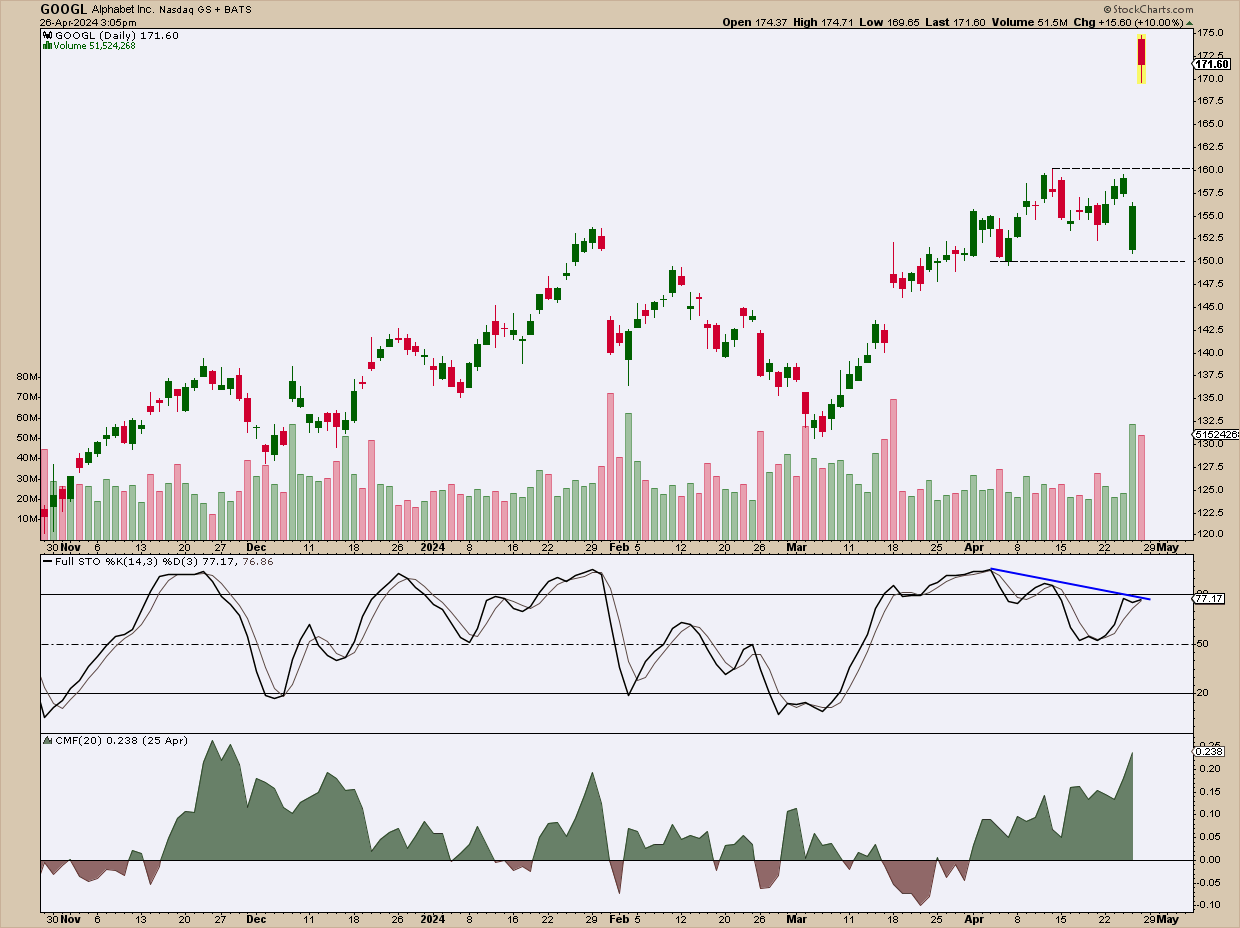
FIGURE 3. DAILY 6-MONTH CHART OF ALPHABET. Huge gap but mixed signals.Chart source: StockCharts.com. For educational purposes.
As a continuation gap, the odds of it getting filled within the week is around 8% (according to analyst Thomas Bulkowski’s studies).
Looking at the candle, you’ll notice heavy selling (profit-taking?) occurred immediately after Friday’s market opening. If you look at the coinciding volume bar, you’ll see that selling activity outpaced buying activity.
The Stochastic Oscillator shows a slight divergence between it and the two consecutive highs in April. But the Chaikin Money Flow (CMF) paints a bullish picture of surging pressure among buyers.
Given the mixed signals, it’s a wait-and-see moment. If the gap gets filled, how close will the price get to $160, the previous high that may serve as support? If it falls through that level, what’s the likelihood it might find support at the most recent swing low range near $150? And if Alphabet bounces in either spot, will there be enough volume and momentum to field its next leg upward?
The Bottom Line
If you’ve been bullish on Alphabet, the green light for loading up on the stock flashed well before the latest earnings shocker—complete with its inaugural dividend and hefty buyback. Strangely enough, perhaps the apparent technical inconsistencies highlighted Alphabet’s underlying strength. At this juncture, it’s a game of watchful waiting to pinpoint the perfect entry point.

Disclaimer: This blog is for educational purposes only and should not be construed as financial advice. The ideas and strategies should never be used without first assessing your own personal and financial situation, or without consulting a financial professional.