


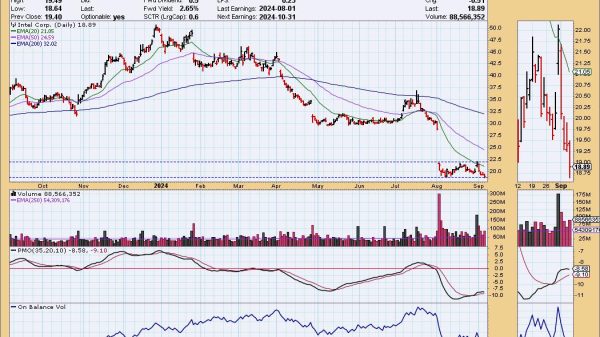


Friday’s CrowdStrike software disaster has been described as “the largest IT outage in history,” and it brought home just how vulnerable the planet is to itty-bitty coding errors. We were busy publishing the DecisionPoint ALERT Weekly Wrap, so I didn’t have a chance to look at the chart until this morning, but what a surprise it was when I saw the sharp OBV negative divergence set up following the high volume on June 21.
The On-Balance Volume (OBV) indicator has been around since the 1960s, but my impression is that it is not widely used. This is probably because the inventor, the late Joe Granville, was such bombastic figure. Nevertheless, I cut my teeth on OBV in the 1980s and have found that OBV divergences are extremely helpful. The problem with OBV is that it is kind of like watching grass grow — divergences are not frequent occurrences. OBV is simple to calculate. The total day’s volume is added or subtracted to/from the running OBV total based upon whether price closes up or down.
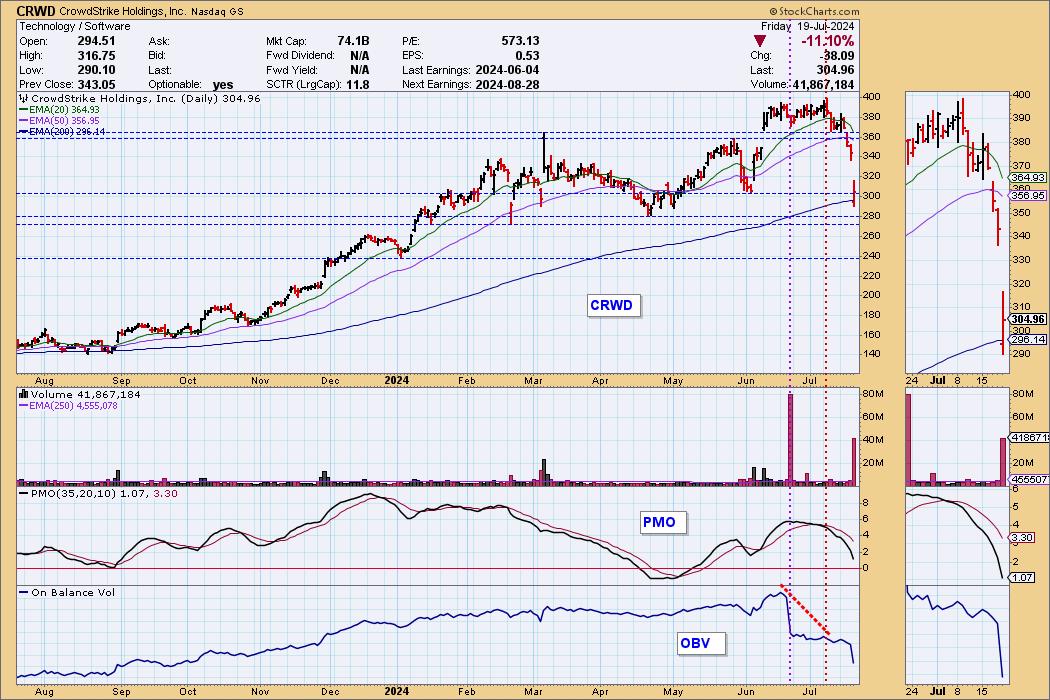
On the chart we can see that CRWD broke to new, all-time highs in June. Then on June 21 it traded down on extremely high volume, setting up the top of an OBV negative divergence. CRWD went on to make another all-time high on July 9, and the same day a lower OBV top set the negative divergence. Also on that day, the PMO crossed down through the signal line (crossover SELL Signal). We see that things started to really deteriorate on Wednesday, and on Friday the genie popped out of the bottle.

OBV divergences are usually much more subtle, so this is not what I would call a “textbook” case. Nevertheless, from the all-time high last week to Friday’s low CRWD declined about -28%, and the chart had plenty of solid, not-so-subtle red flags. This chart makes a good case for OBV in particular, and technical analysis in general.
–Carl Swenlin
Learn more about DecisionPoint.com:
Watch the latest episode of the DecisionPointTrading Room on DP’s YouTube channel here!

Try us out for two weeks with a trial subscription!
Use coupon code: DPTRIAL2 at checkout!
Technical Analysis is a windsock, not a crystal ball. –Carl Swenlin
(c) Copyright 2024 DecisionPoint.com
Disclaimer: This blog is for educational purposes only and should not be construed as financial advice. The ideas and strategies should never be used without first assessing your own personal and financial situation, or without consulting a financial professional. Any opinions expressed herein are solely those of the author, and do not in any way represent the views or opinions of any other person or entity.
DecisionPoint is not a registered investment advisor. Investment and trading decisions are solely your responsibility. DecisionPoint newsletters, blogs or website materials should NOT be interpreted as a recommendation or solicitation to buy or sell any security or to take any specific action.
Helpful DecisionPoint Links:
Price Momentum Oscillator (PMO)
Swenlin Trading Oscillators (STO-B and STO-V)