


Another interesting week in the stock market comes to an end.
The past few days were flooded with the twists and turns of President Trump’s reciprocal tariffs, which were later put on a 90-day pause except for China, which got hit with higher tariffs.
Then came China’s retaliation, which stirred the pot even more. Where tariffs between the two countries will end up is anyone’s guess, but all it’s doing now is adding to even more uncertainty.
The wild swings that we are seeing in the stock market’s price action make it a challenging environment for investors and traders. And with consumer confidence weakening, investors are getting nervous and confused. When the stock market environment is dominated by wild swings based on news headlines, it makes analyzing price charts more difficult. Many charts are technically broken down, and indicators tend to be more skewed due to the recent wide-ranging days.
The daily chart of the SPDR S&P 500 ETF (SPY) is a great example of how the crazy wild swings of the last six days aren’t doing much to help determine trend direction.
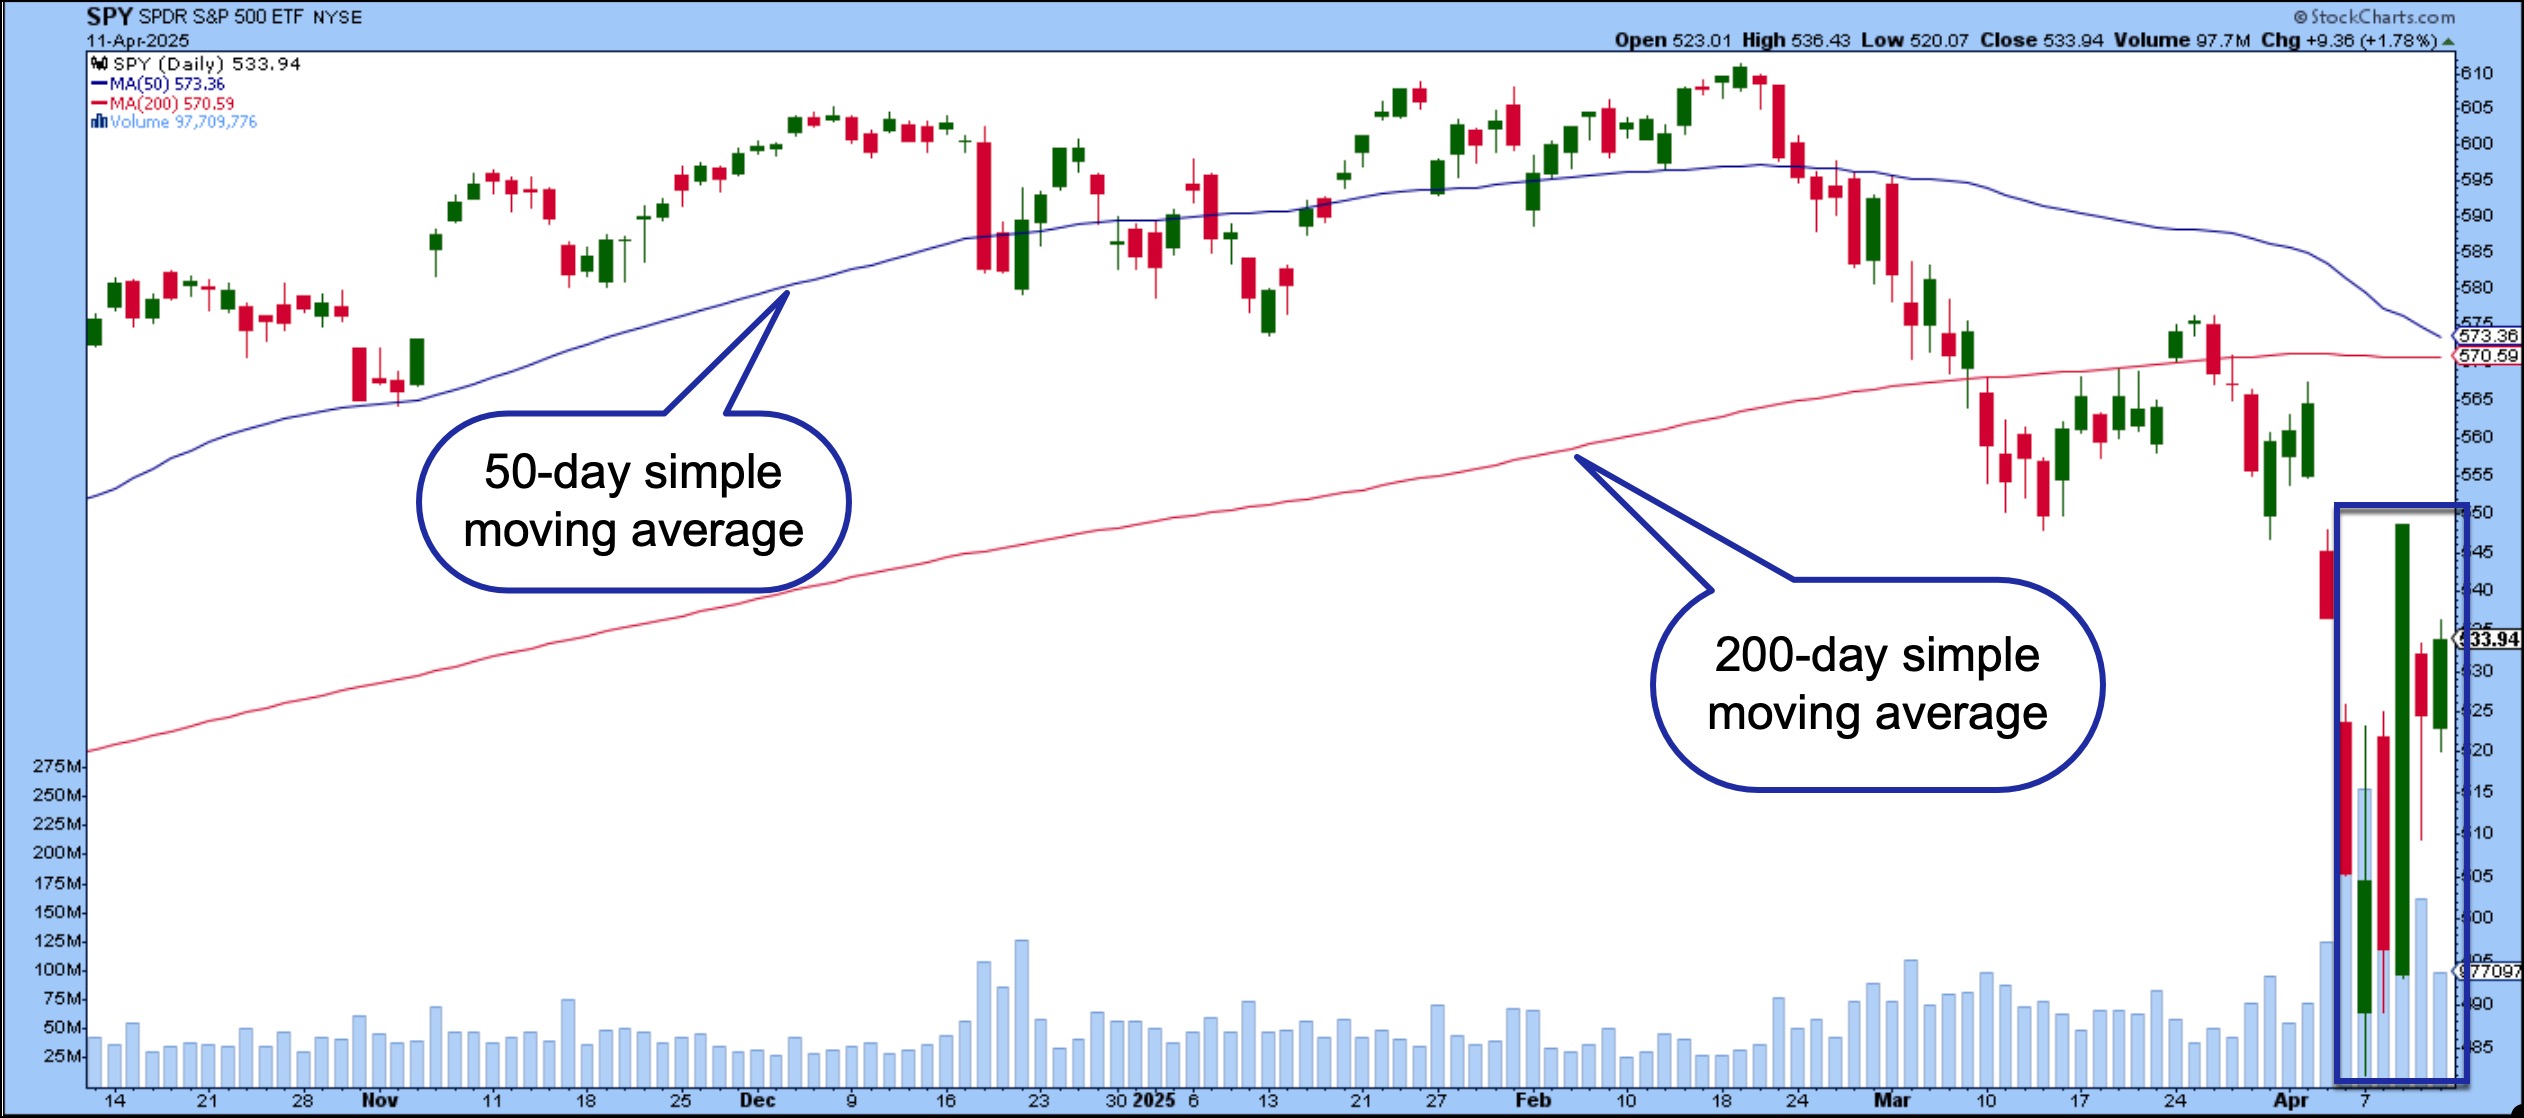
FIGURE 1. DAILY CHART OF SPY. The last six trading days have been erratic to say the least. It makes it impossible to determine whether the bulls or bears are in control. Chart source: StockCharts.com. For educational purposes.
The last six candlestick bars display erratic movement with wide range days. Note the 50-day simple moving average (SMA) is trending downward and getting close to the 200-day SMA. While the overall trend is pointing lower, it’s difficult to tell if SPY will move lower or reverse.
You’re better off looking at a longer-term chart, such as a weekly or monthly one, to get a sense of the overall trend direction. The weekly chart of the SPY is less erratic and restores faith in the technical analysis.
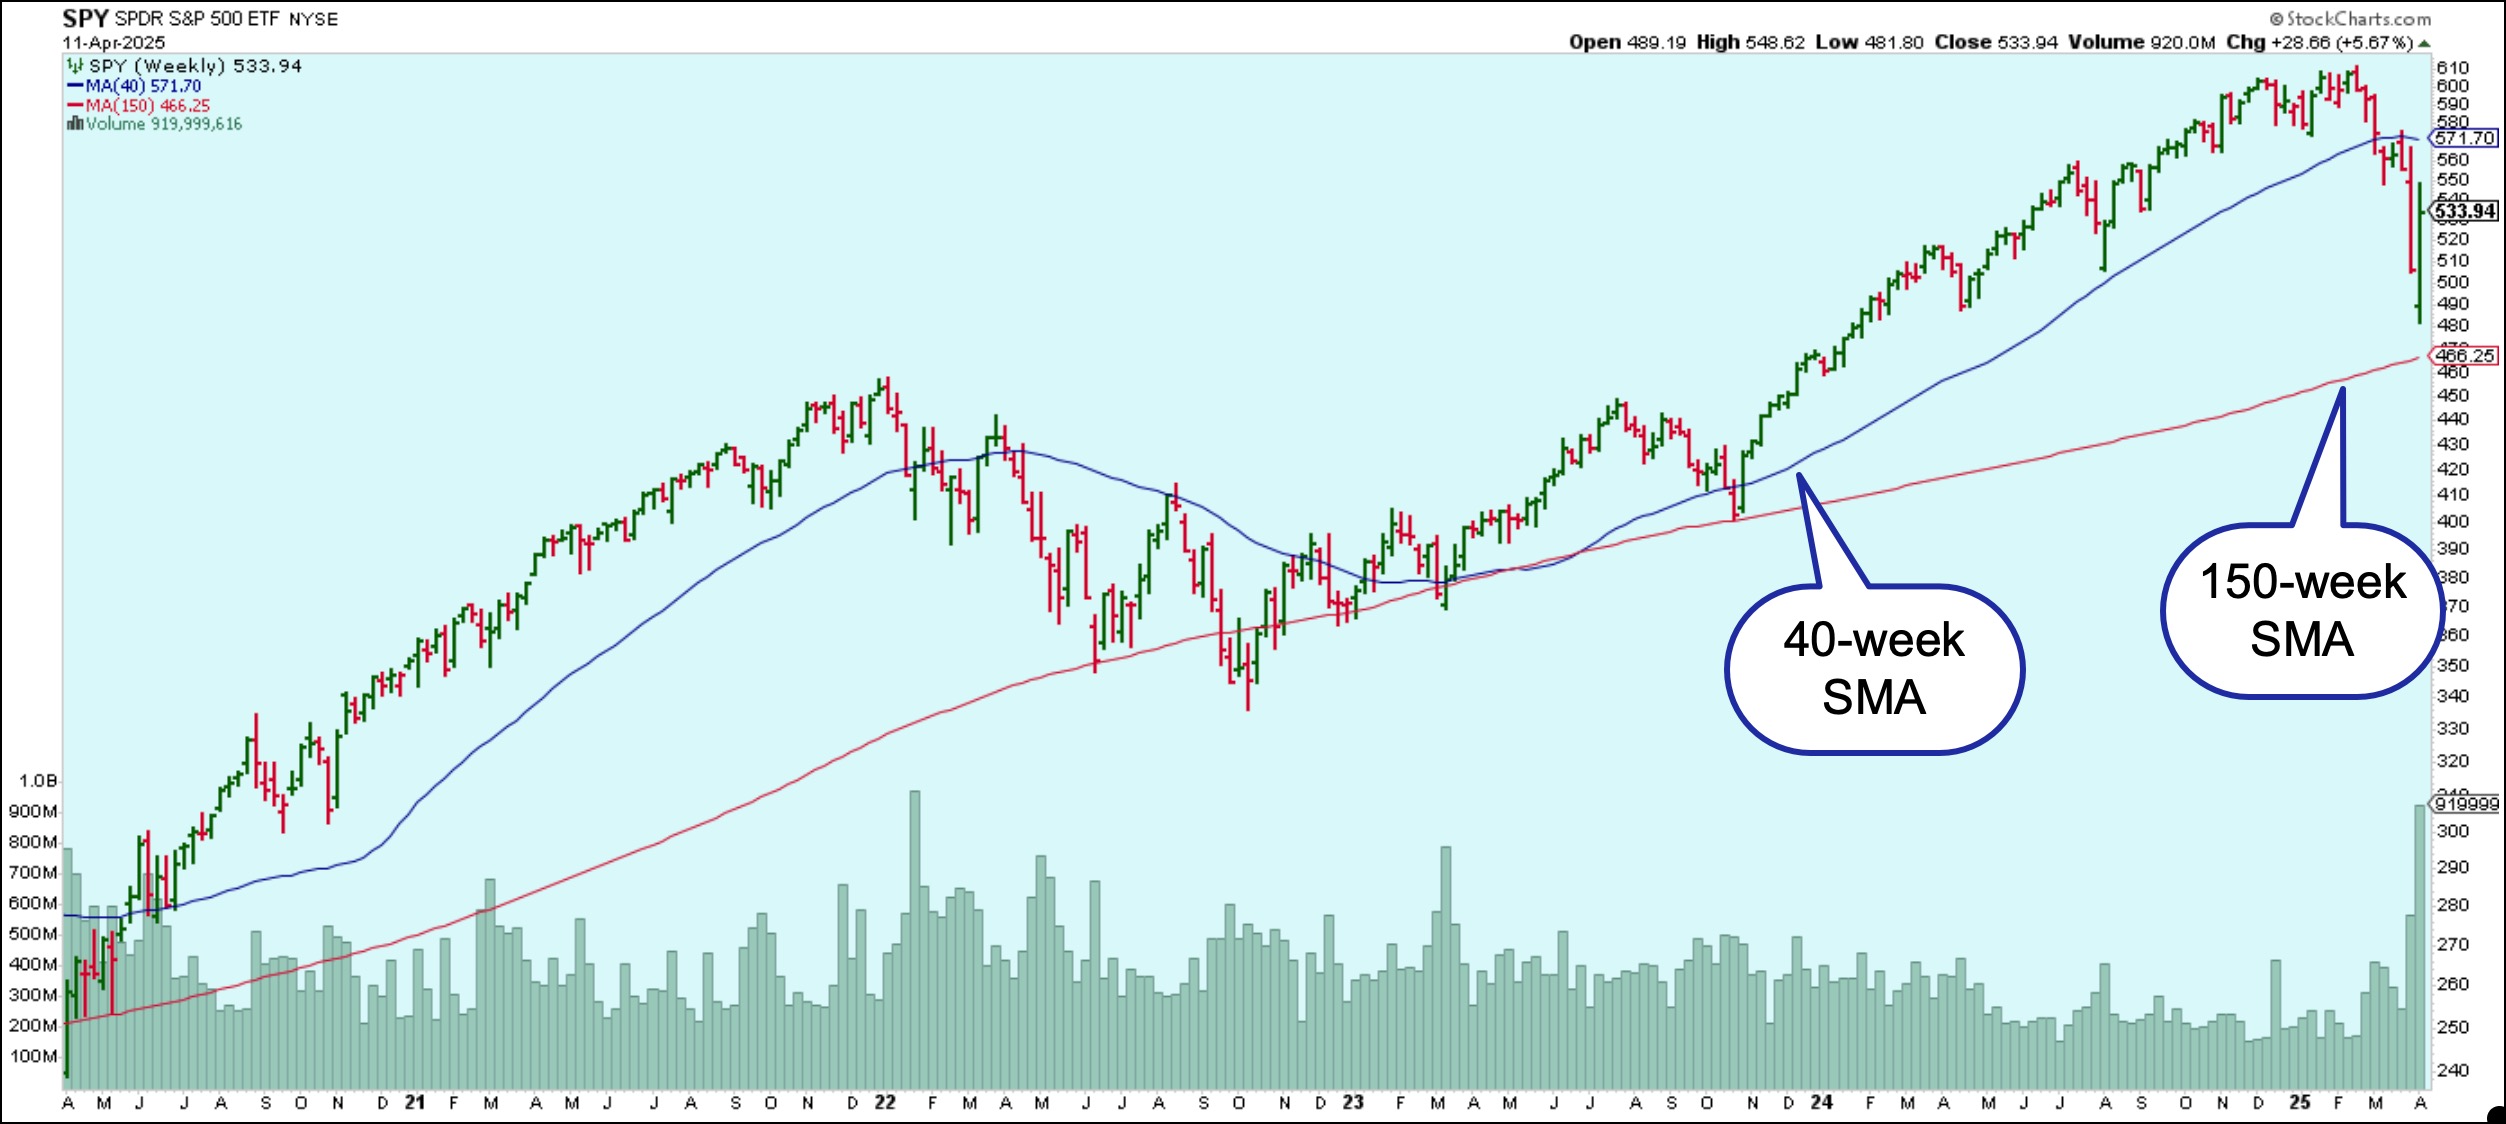
FIGURE 2. WEEKLY CHART OF SPY. This is much calmer and clearly shows the longer-term trend. Chart source: StockCharts.com. For educational purposes.
Even though it’s clear that SPY has broken below its 40-week SMA, it’s still above its 150-week, which is a ray of hope. Let’s see where it ends up next week. The more concerning point is that the range of the last two bars is the widest it has been in the last five years.
Watch Bonds
You can’t get past this week’s market action without noticing bonds. With higher tariffs, you’d expect yields to fall, but we’re not seeing that happen. On Friday, the 10-year Treasury yield hit a high of 4.59% on Friday and the 30-year went as high as 4.99%. Although yields pulled back, they are still relatively high.
Bond prices came back a bit after hitting a low that almost coincided with its January low (red dashed line). See the chart of iShares 20+ Year Treasury Bond ETF (TLT) below.
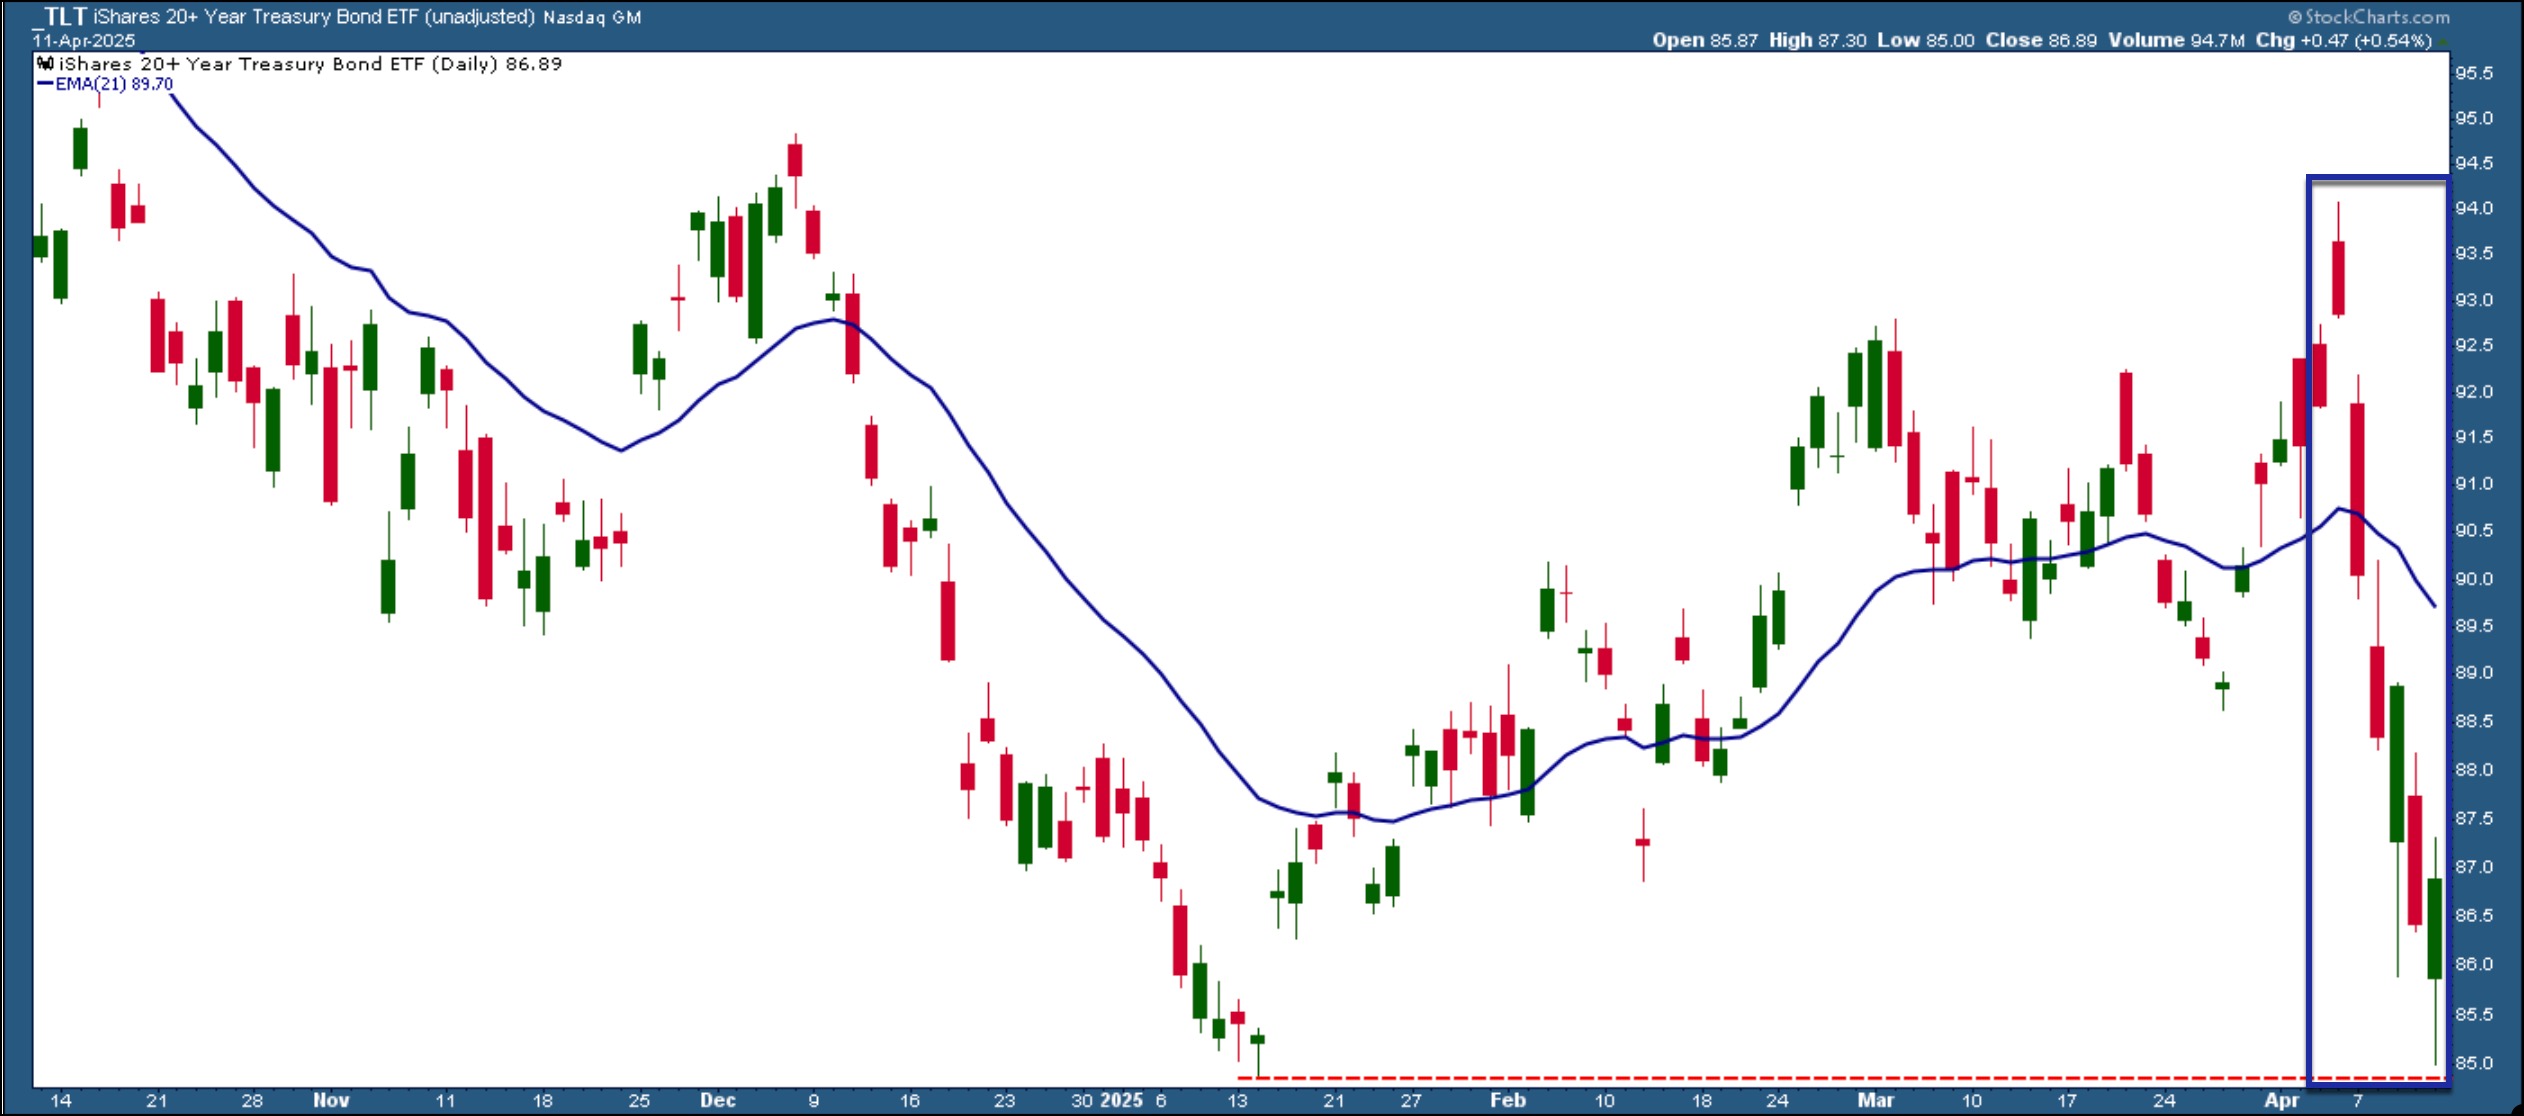
FIGURE 3. DAILY CHART OF TLT. Note the steep decline in the last six bars. Although bond prices came back on Friday, there’s no knowing what will happen next week. Watch this chart closely. Chart source: StockCharts.com. For educational purposes.The big question is if Friday’s upside move is enough to reverse the trend in bond prices. Momentum indicators are still weak and trending to the downside, and, from a technical perspective, it’ll take a lot for bond prices to trend higher.
Falling bond prices don’t bode well for investors. Typically, when equities fall, bond prices rise. Yet we’re seeing the opposite occurring. That investors are selling US bonds and looking at alternative safe-havens worries Wall Street. The rise in bond prices also makes the White House nervous, and it puts the Federal Reserve in a tight spot.
Tariffs can send inflation higher and, generally, an inflationary environment does not support interest rate cuts. But if the US finds itself in a position where inflation is rising and economic growth is slowing, the Fed may have to cut rates.
Who knows what we will hear next week? Remember, this is a headline-driven market, and any news can send values moving drastically in either direction. On Friday afternoon, stocks reversed on the heels of a news release from the White House stating that a deal with China could be in the works. You can’t rule out a weekend risk.
The Dollar Weakens
Another unusual move is the weakening of the US dollar. Increasing tariffs should strengthen the US dollar. Instead, the dollar is weakening. The daily chart of Invesco DB US Dollar Index Bullish Fund (UUP) shows the ETF is trading well below its 200-day SMA (red line).
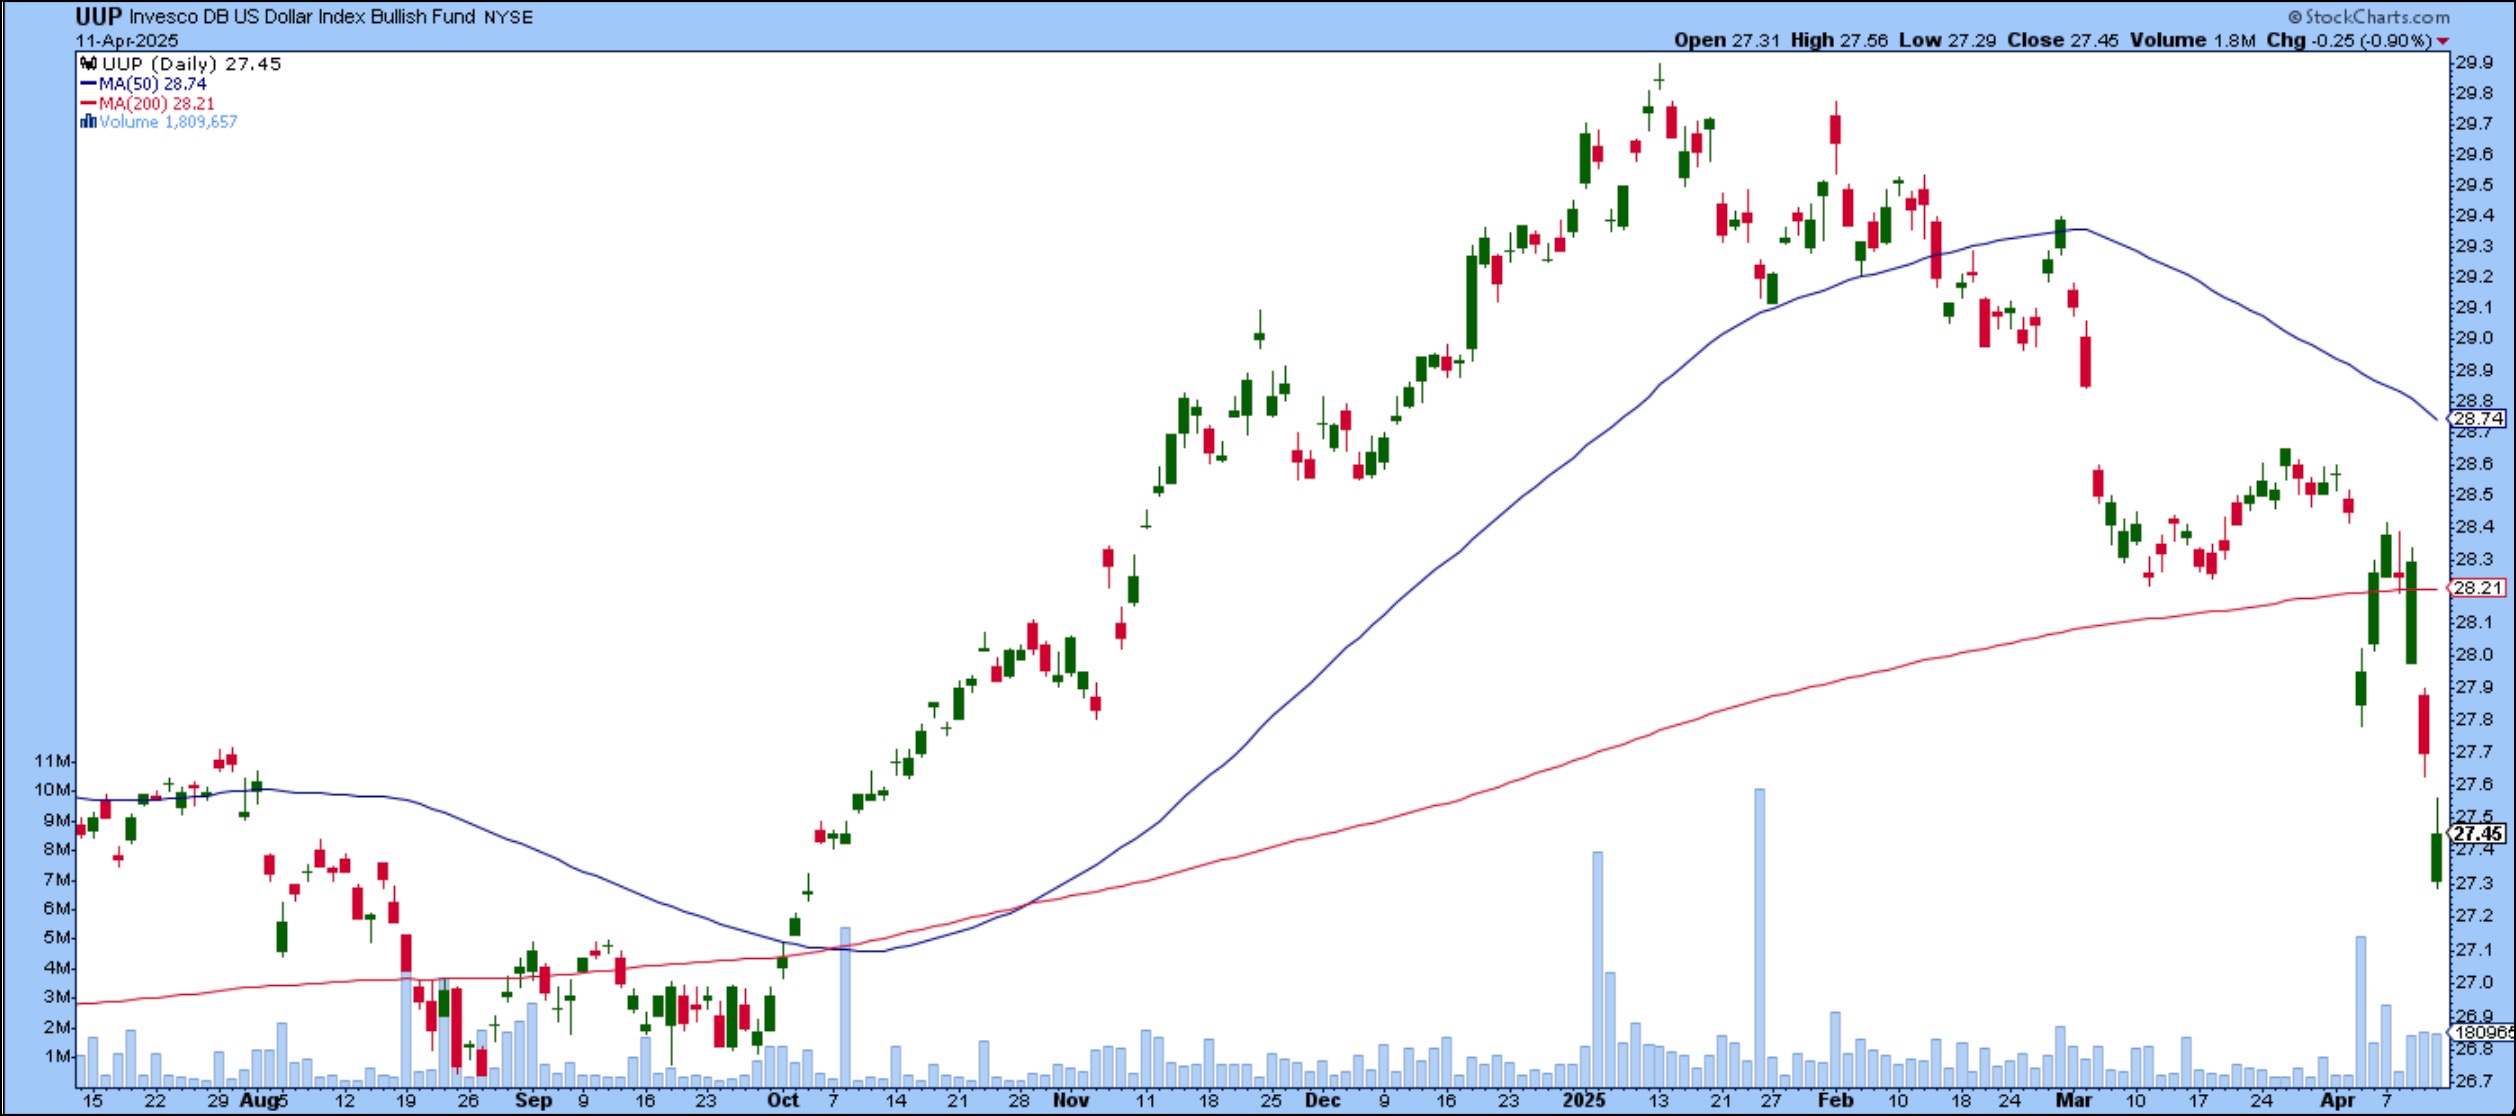
FIGURE 4. DAILY CHART OF UUP. The ETF is trading below its 200-day SMA. Will it hit its 52-week low? Chart source: StockCharts.com. For educational purposes.
The US dollar is showing no signs of a turnaround in the US dollar. The euro, British pound, Swiss franc, and Japanese yen are strengthening against the dollar. Pull up the charts of $EURUSD, $GDPUSD, $USDSCHF, and $USDJPY on the StockCharts platform and follow the currency markets. Or head over to the revised Market Summary page, scroll down to the Other Assets panel, and click the Currencies tab. you’ll see all the currency pairs listed.
The Bottom Line
Downtrends in equities, US bond prices, and the US dollar send a message that investors are selling US assets. Where are they parking their cash? Gold is one place. Interest in gold has gone through the roof with gold prices hitting a new all-time high on Friday. When things are as uncertain as they are now, it’s time to step back and observe the macro landscape. That means viewing long-term equity charts, bonds, and currencies. Bonds are critical in this landscape. They give a big picture of the overall strength of the US economy.

End-of-Week Wrap-Up
- S&P 500 up 5.70% on the week, at 5363.36, Dow Jones Industrial Average up 4.95% on the week at 40,212.71; Nasdaq Composite down 7.29% on the week at 16,724.46
- $VIX down 17.10% on the week, closing at 37.56.
- Best performing sector for the week: Information Technology
- Worst performing sector for the week: Real Estate
- Top 5 Large Cap SCTR stocks: Elbit Systems, Ltd. (ESLT); Anglogold Ashanti Ltd. (AU); Palantir Technologies, Inc. (PLTR); Gold Fields Ltd. (GFI); RocketLab USA, Inc. (RKLB)
On the Radar Next Week
- Earnings from Bank of America (BAC), United Airlines (UAL), Citigroup (C); Johnson and Johnson (JNJ), Charles Schwab (SCHW), and many more
- March export and import prices
- March Retail Sales
- March Industrial Production and Manufacturing Production
- March Housing Starts
- Several Fed speeches
Disclaimer: This blog is for educational purposes only and should not be construed as financial advice. The ideas and strategies should never be used without first assessing your own personal and financial situation, or without consulting a financial professional.