


As part of our regular market review in the DP Alert, we have begun to notice a very good indicator to determine market weakness and strength. It may not be new to all of you, but we’ve found as of late this indicator tells a story.
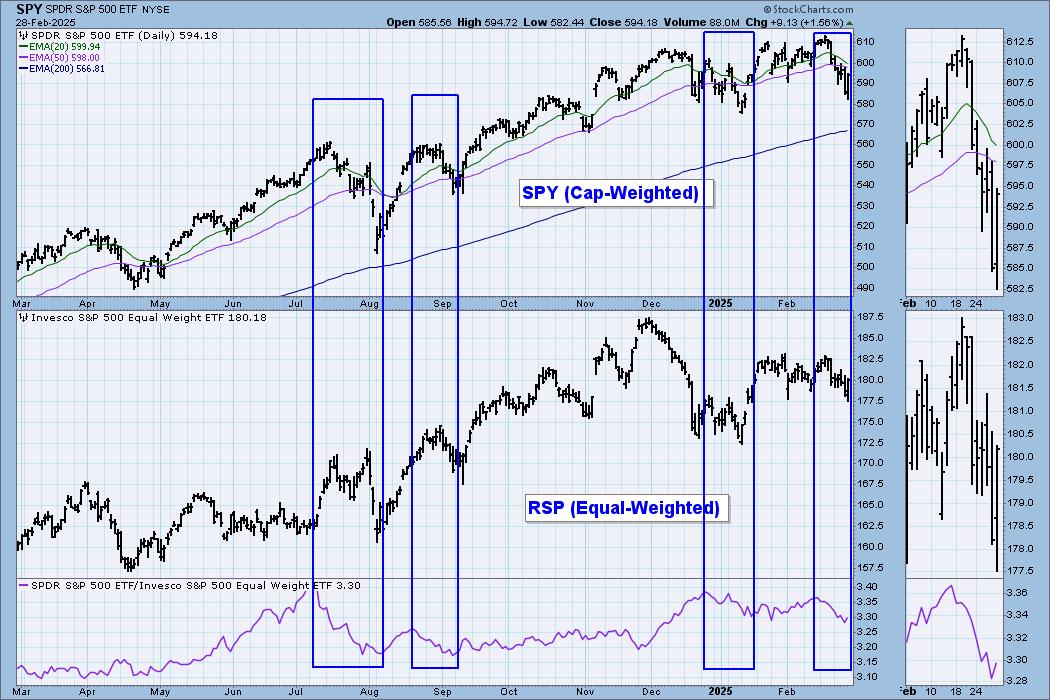
We have been tracking the relative strength of the SPY to equally-weighted RSP. When the relative strength line is rising, it means that mega-cap stocks are leading the market. When the relative strength line is falling, mega-cap stocks are taking a back seat.
The chart below shows you what happens when the mega-caps start to slide against RSP. The market itself usually travels lower (as does equal-weight RSP). It doesn’t happen every time, but it happens enough that we should be checking this chart regularly. If you are an Extra member or above with StockCharts.com, you can click on this chart and save it to your own ChartList for monitoring.
Currently mega-caps are underperforming RSP and that has spelled trouble for the market. It did tip upward Friday, but ultimately the relative strength line is in a declining trend. We’ll want to watch for a move out of that declining trend.

Conclusion: Cap weighting has made it important to monitor how the SPY is performing in relation to equal-weight RSP. A declining relative strength line is bad for the market as a whole and that is what we are currently seeing.
The DP Alert: Your First Stop to a Great Trade!
Before you trade any stock or ETF, you need to know the trend and condition of the market. The DP Alert gives you all you need to know with an executive summary of the market’s current trend and condition. It not only covers the market! We look at Bitcoin, Yields, Bonds, Gold, the Dollar, Gold Miners and Crude Oil every day! Only $50/month! Or, use our free trial to try it out for two weeks using coupon code: DPTRIAL2. Click HERE to subscribe NOW!
Learn more about DecisionPoint.com:
Watch the latest episode of the DecisionPointTrading Room on DP’s YouTube channel here!

Try us out for two weeks with a trial subscription!
Use coupon code: DPTRIAL2 Subscribe HERE!
Technical Analysis is a windsock, not a crystal ball. –Carl Swenlin
(c) Copyright 2025 DecisionPoint.com
Disclaimer: This blog is for educational purposes only and should not be construed as financial advice. The ideas and strategies should never be used without first assessing your own personal and financial situation, or without consulting a financial professional. Any opinions expressed herein are solely those of the author, and do not in any way represent the views or opinions of any other person or entity.
DecisionPoint is not a registered investment advisor. Investment and trading decisions are solely your responsibility. DecisionPoint newsletters, blogs or website materials should NOT be interpreted as a recommendation or solicitation to buy or sell any security or to take any specific action.
Helpful DecisionPoint Links:
Price Momentum Oscillator (PMO)
Swenlin Trading Oscillators (STO-B and STO-V)